Why do we like Bridge Investment Group Holdings Inc?
According to Preqin's 2022 Global Alternatives study, alternative asset managers now hold $13 trillion in assets under management (AUM). AUM is expected to grow at a compound annual growth rate of 15.4% (CAGR) to reach $23.2 trillion by 2026.
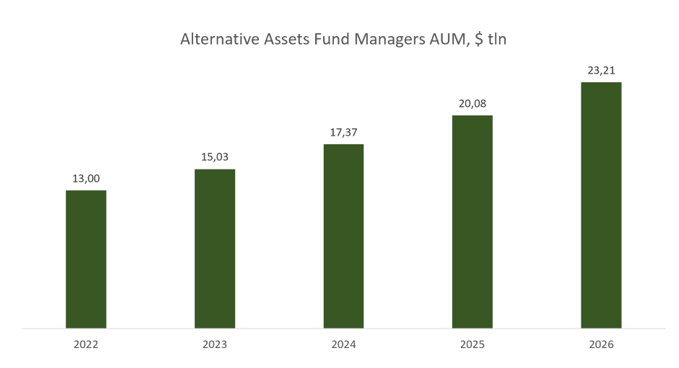
AUM of alternative asset managers; source: compiled by the author
Real estate is the largest asset class in alternative investments. According to the National Association of Real Estate Investment Trusts (NAREIT), the total size of the commercial real estate market was estimated at $20.7 trillion in 2021, with assets under management of real estate managers at $4.65 trillion in 2020 and around $4.92 trillion in 2021.
Given that Bridge Investment Group now has $43.8 billion in assets under management, the firm accounts for less than one per cent of total assets involved in the industry. This suggests significant potential for further organic growth for the firm.
Strong positioning
Many of the funds managed by the company are in the top quartile of the Preqin ranking, meaning that Bridge is among the top 25% of asset managers with the best returns. High performance provides the company with a strong positioning and facilitates successful fundraising even in the current macroeconomic uncertainty. For example, since the beginning of the year, assets under management have grown by 20.7% to $43.8 billion and the stock of so-called 'dry powder' (idle liquid assets ready for investment) has reached $3.9 billion. It is worth noting that the average AUM holding period is 7.9 years, which protects Bridge from possible asset outflows.
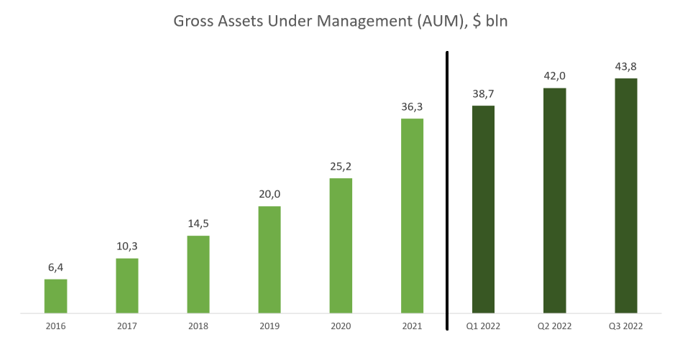
Volume of assets under Bridge management; source: compiled by the author
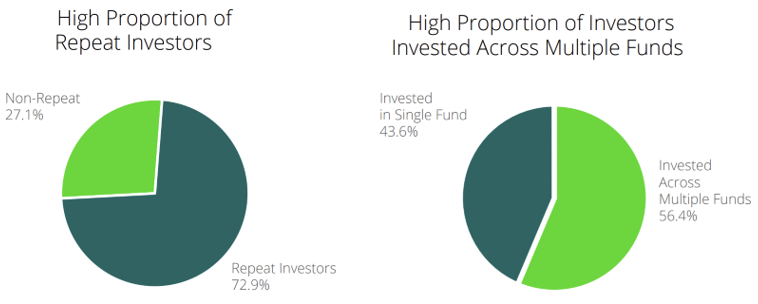
The firm's strong performance has enabled it to generate significant investor loyalty and high retention rates: 72.9% of AUM are repeat investors and 56.4% of them invest in more than one fund.
Investor retention rates; source: Company Presentation
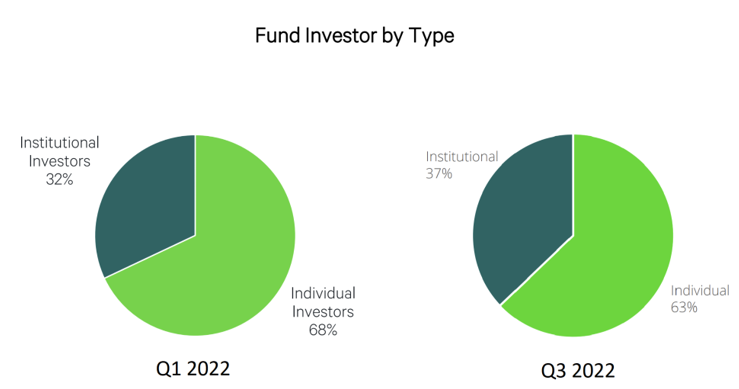
Notably, there has been a change in the structure of AUM by investor type in favour of institutional investors. While institutional investors accounted for 32% of assets in the first quarter, the figure reached 37% at the end of the third quarter. This trend is likely to continue, as 65% of investment commitments in the third quarter came from institutional investors and only 35% from individual investors.
AUM structure by investor type; source: Company Presentation
The high performance of funds under management, a strong proportion of repeat investors and a supply of "dry powder" will ensure that the company will navigate through adverse market conditions with relative ease. An increased proportion of institutional investors will boost Bridge's financial performance over the long term, as they occupy a leading role in the capital market.
International expansion and the launch of new strategies
Bridge is actively increasing its international presence. The company has expanded its offices in Luxembourg and South Korea and also obtained a European licence to manage an alternative asset fund (AIFM). These initiatives are expected to enable the company to attract assets abroad more actively. The share of international investors increased from 32% in the first quarter to 34% in the third quarter. 43% of investment commitments in the last quarter were received from international investors.
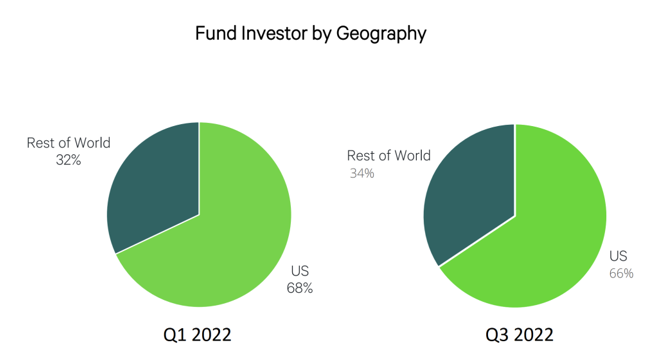
Structure of AUM by geography; source: Company Presentation
According to management , Bridge has quite a few investors from the Middle East. Current oil prices are expected to encourage capital inflows from the region. In addition, the company announced a wide-ranging strategic partnership with KB Asset Management, South Korea's largest financial conglomerate, in which Bridge will serve KB's interests in the US real estate market.
Over the past year, Bridge has launched five new investment strategies with the potential to become additional growth drivers: Solar, Ventures, Single Family Rental, Logistics and Net Lease Income.
- As part of its strategy, Solar Bridge, in partnership with Lumen Energy, plans to build and operate renewable energy infrastructure on existing commercial properties.
- As part of its Ventures strategy, the company plans to invest in transformational real estate technology ventures that can improve efficiency and operational performance of properties.
- Bridge has acquired a majority stake in Gorelick Brothers Capital and launched a Single Family Rental strategy as part of its Bridge Homes offering. Bridge Homes has a portfolio of approximately 2700 homes in 14 markets, concentrated in the Sun Belt and Midwest US, and aims to provide investors with recession resilience.
- The Logistics strategy focuses on logistics assets capable of delivering high rates of return and growth potential. The primary focus is on markets with increasing population density, high e-commerce penetration and limited supply.
- The Net Lease Income strategy focuses on critical industrial, manufacturing and logistics real estate infrastructure that is acquired and leased.
To date, only three strategies are already contributing to the financial performance - Single Family Rental, Logistics and Net Lease Income. It is worth noting that the share of these strategies in total AUM increased in the last reporting period.
We have yet to see the impact of Solar and Ventures. Clearly, Solar represents significant potential as it involves investment in a huge and growing green energy market, fuelled by sensitivity to high hydrocarbon prices and initiatives by various nations.
International expansion and the launch of new strategies
If the challenging macroeconomic environment is sustained, Bridge's stock price will be supported by dividend payments. Today, the company provides shareholders with a yield of 7.9%, one of the best performers in the alternative investments industry.
However, it is worth noting that the company's policy is to distribute virtually all net profits to shareholders, making dividends potentially volatile.
Financial indicators
Bridge's financial results over the past 12 months can be summarised as follows:
- Bridge's largest item of income is fund management fees, which are charged on the total amount of capital invested and are independent of performance. This increased by 38.6% to $216.1 million at the end of the last reporting period.
- Property management fees amounted to $72.9 million, up 4.6% on 2021.
- Transaction fees rose by 10.3% to $82.8 million from $75.1 million at the end of the year.
- Total revenues were $420.7 million, compared to $330 million for the year.
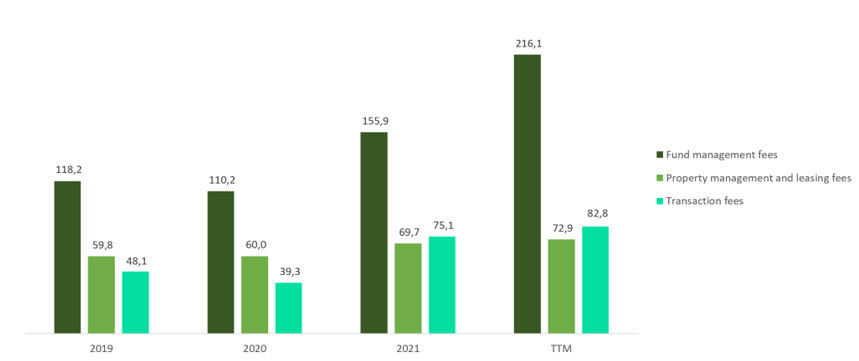
Main components of company revenues; source: compiled by the author
- Total investment income was virtually unchanged at $334.7 million compared to $334.2 million for the year.
- The largest components of investment income are realised gains and unrealised gains on the assets acquired. Realised gains were $73.6 million compared to $81 million for the year.
- Unrealised growth increased by 3.5% to $257.3 million from $248.6 million at the end of the year.
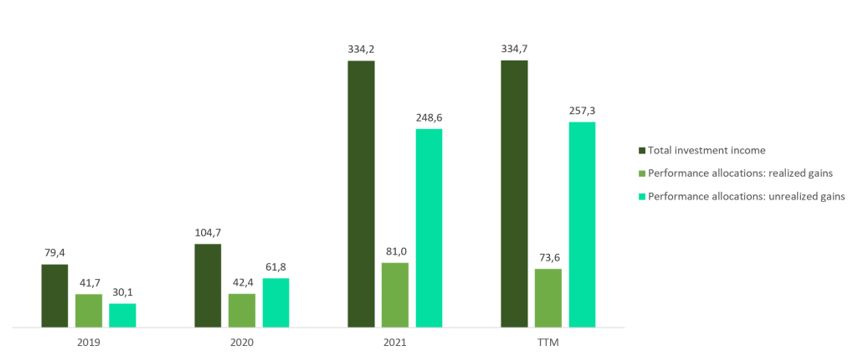
Main components of total investment income; source: compiled by the author
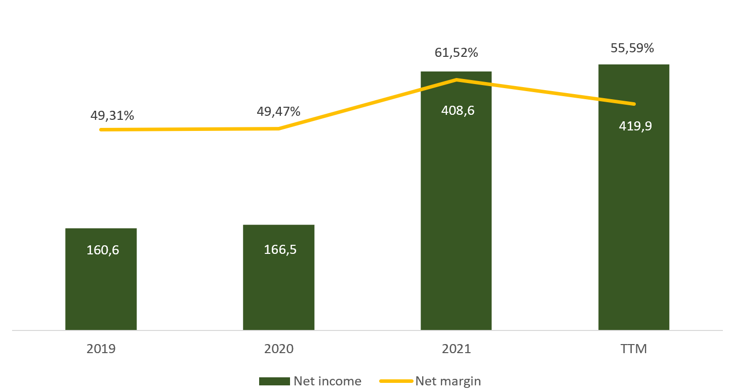
Bridge has seen steady growth in net profit over the past few years. At the end of the last reporting period, the figure for the last 12 months (TTM) was $419.9 million, an increase of 2.8% year-on-year. Net profit margin declined from 61.52% to 55.59%, driven by a 47.3% increase in employee compensation and benefits during the first nine months of 2022.
Company net profit and margin dynamics; source: compiled by the author
The financial results for Q3 2022 are shown below:
- Total revenues amounted to $110.4 million, up 19.7% year-on-year, driven by growth in assets under management and, consequently, management fees.
- Total investment income showed a significant drop: from $84.9 million last year to $6.8 million.
- Net income was $32.2 million compared to $118.9 million a year earlier. The decrease was due to a reduction in total investment income.
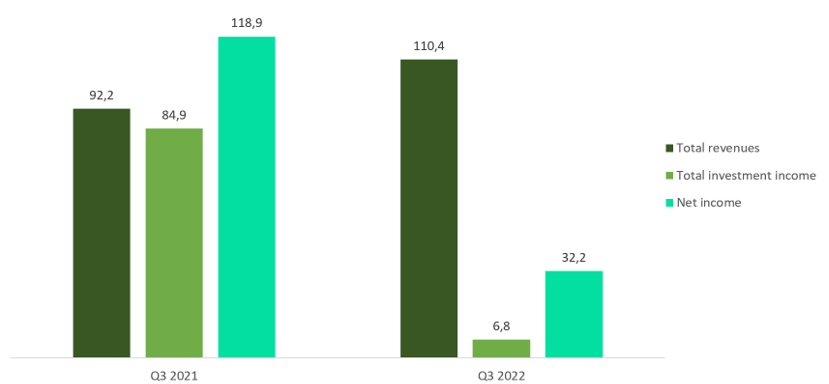
Company financial results for Q3 2022; source: compiled by the author
The release of Q3 2022 results was followed by a negative market reaction, due to a significant reduction in investment income and net income. However, we remain optimistic about the company, as the key factor behind the underperformance is the reduction in unrealised growth. The value of unrealized assets is determined based on the company's internal methodology and does not affect cash flow.
The results of companies in the asset management industry are highly volatile, with investment income falling during periods of pessimism but recovering just as quickly when the market is bullish. With an average AUM holding period of 7.9 years, Bridge is protected from asset outflows and will continue to earn fees, which will support the firm's financial performance.
In addition, the current stock of "dry powder" allows asset purchases in the current market in a relatively low price environment. Investing in the current environment can be an important driver for the future performance of the firm.
In the last reporting period TTM operating cash flow (Cash from operations) amounted to $238.7 million against $209.2 million for the year. Free cash flow to equity increased from $208.1 million to $238.0 million. The growth was driven by an increase in assets under management and, consequently, fee and commission income.
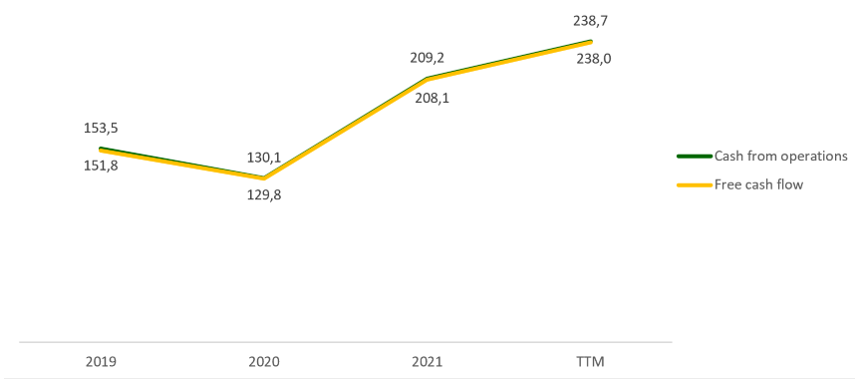
Company cash flow; source: compiled by the author
Bridge has a healthy balance sheet, with total debt of $297.2 million, Total Cash & ST Investments of $200.5 million and net debt of $96.7 million, which is 2.5 times less than operating cash flow - Net Debt / Cash From Operations - 0.4x.
Evaluation
Bridge trades at a discount to the industry average: EV/Sales - 2.89x, P/Cash flow - 6.34x, P/E - 11.68x, P/B - 17.88x.
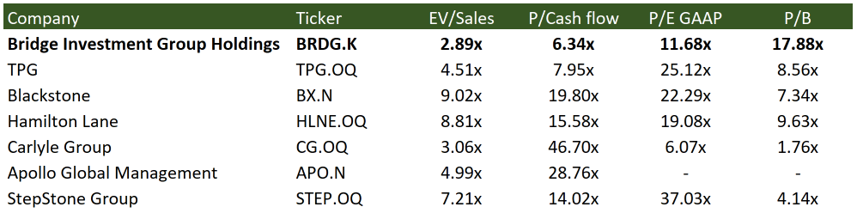
Comparable estimate; source: compiled by the author
The minimum price target from investment banks, set by Credit Suisse, is $13.50 per stock. J.P. Morgan, on the other hand, values BRDG at $23. By consensus, the fair market value of the stock is $18.80, suggesting a 46.3% upside potential.
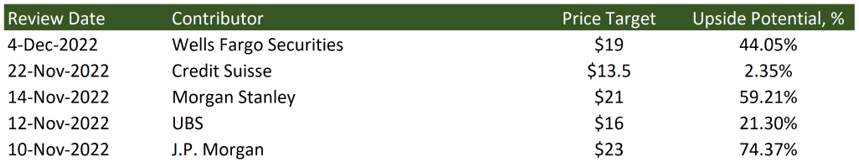
Price targets of investment banks; source: compiled by the author
Key risks
- The asset management industry is highly sensitive to economic cycles. If the economy plunges into recession, Bridge could face a further slowdown in fundraising and revenue would fall significantly.
- Bridge has to compete with market gian such as Blackstone and Apollo Global Management not only for available assets, but also for investment properties. This factor may affect the company's ability to grow organically in the long term.
Sources of information
- https://www.privateequitywire.co.uk/2022/01/14/311145/alternative-assets-reach-usd2321tn-2026-says-preqin-report
- https://ir.bridgeig.com/sec-filings/all-sec-filings/content/0000950170-22-004163/0000950170-22-004163.pdf
- https://irei.com/wp-content/uploads/2021/10/2021-PFR-IREI-REPORT-US.pdf
- https://www.ibisworld.com/industry-statistics/market-size/real-estate-asset-management-consulting-united-states/
- https://seekingalpha.com/article/4557019-bridge-investment-group-holdings-inc-brdg-q3-2022-earnings-call-transcript
- https://d1io3yog0oux5.cloudfront.net/_ad64feba72b54f6b308b3f7b8f4d403d/bridgeig/db/1936/17727/earnings_presentation/BRDG+2022.09.30+Earnings+Presentation_FINAL_.pdf
- https://d1io3yog0oux5.cloudfront.net/_ad64feba72b54f6b308b3f7b8f4d403d/bridgeig/db/1912/17718/pdf/BridgeIG+-+1Q22+earnings+presentation+vFINAL_.pdf
- https://d1io3yog0oux5.cloudfront.net/_ad64feba72b54f6b308b3f7b8f4d403d/bridgeig/db/1912/17725/pdf/BRDG+2022.06.30+Earnings+Presentation+vFinal.pdf
- https://ir.bridgeig.com/sec-filings/quarterly-reports/content/0001854401-22-000025/0001854401-22-000025.pdf
Recommendation Evaluation Methodology
Lion Capital Group analysts perform a three-stage analysis. They select a promising industry based on the latest news, statistics and industry-specific metrics. They assess the supply and demand situation and its future development dynamics. Industry’s investment attractiveness is mostly affected by the forecasted market growth rates; total addressable market, player concentration level and likeliness of a monopoly formation, as well as the level of regulation by various entities or associations.
The assessment is followed by the comparative analysis based on the selected sample. The sample comprises companies with a market capitalization of over USD 1 billion, but there is space for exceptions (when the suitable level of liquidity for company’s securities is available on the stock exchange). The selected companies (peers) are being compared against each other based on multipliers (EV/S, EV/EBITDA, PE, P/FCF, P/B), revenue growth rates, marginality and profitability (operating income margin, net income margin, ROE, ROA), and business performance.
Having completed the comparative analysis, the analysts carry out a more in-depth research of the news about the selected company. They review company’s development policy, information about its current and potential mergers and acquisitions (M&A activity), and assess the efficiency of company's inorganic growth and other news about it over the past year. The main objective at this stage is to identify the growth drivers and evaluate their stability, as well as the extent of impact they have on the business.
Based on all the data collected, the analysts determine the weighted forecasted figures of company’s growth rates and proposed business marginality, which are used to calculate the company’s multiplier-based estimated value. The said value enables setting the stock price target and stock value growth potential.
The expected timing of the idea implementation is set depending on the current market situation, volatility level and available forecasting horizon for industry and company development. The forecasting period is normally set between 3 and 12 months.
Disclaimer
Information and analytical services and materials are provided by Lion Capital Group as part of the services specified and are not an independent activity. The Company reserves the right to refuse service to persons not meeting the criteria for clients, or those subject to bans / restrictions on such services in accordance with the European Union laws. Restrictions may also be imposed by the internal procedures and controls of Lion Capital Group. Lion Capital Group provides financial services in the European Union in accordance with license CIF 275/15 for all types of activities required by the company as granted by the Cyprus Securities and Exchange Commission (CySEC) on 20.05.2015. Disclaimer: Additional information is available upon request. Investing in securities and other financial instruments always involves the risk of capital loss. The client must personally acknowledge this, including by reading the Risk Disclosure Notice. Opinions and estimates represent our judgments as of the date hereof and are subject to change without notice. Fees, charges and other expenses may reduce the financial performance of your investment. Past returns do not guarantee future returns. This material is not intended to be an offer or solicitation to buy or sell any financial instrument. The opinions and recommendations provided herein do not consider any individual circumstances, goals or needs of the client and do not constitute an investment advisory service. Recipients of this report must make their own independent decisions in relation to any securities or financial instruments referred to herein. The information has been obtained from sources that Lion Capital Group believes to be reliable; its affiliates and/or subsidiaries (jointly referred to as Lion Capital Group) do not guarantee completeness or accuracy of such information, save for disclosures related to Lion Capital Group and/or its affiliates/agents and analyst's interactions with the issuer being the subject of research. All prices provided are indicative closing prices for the securities in question, unless otherwise specified.
Terms and conditions of market research use
Company income statement
| 2023 | |
|---|---|
| Revenue | 330.01M |
| EBITDA | 272.30M |
| Net Income | 252.71M |
| Net Income Ratio | 76.57% |
Financial strength
| 2023 | |
|---|---|
| Debt/Eq | 413.10% |
| FCF Per Share | 9.57 |
| Interest Coverage | 13.89 |
| EPS | 11.62 |
| Payout ratio | 72.15% |
Management efficiency
| 2023 | |
|---|---|
| ROAA | 29.86% |
| ROAE | 352.02% |
| ROI | 15.84% |
| Asset turnover | 0.39 |
| Receivables turnover | 2.19 |
Margin
| 2023 | |
|---|---|
| Gross Profit Margin | 56.76% |
| Net Profit Margin | 76.57% |
| Operating Profit Margin | 35.80% |