Why do we like Bridge Investment Group Holdings Inc?
Reason 1. Maintaining inorganic growth through M&A deals
The market in which MarineMax operates is large, with sales from its five company-owned brands currently accounting for 19% of market potential.
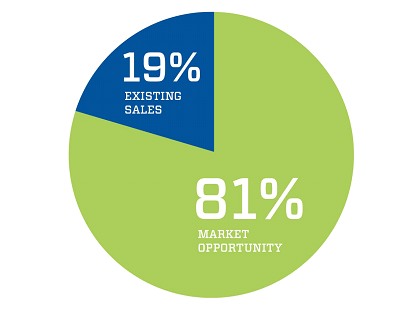
Demonstrating these statistics, management stresses that MarineMax has room to grow and therefore expand its share. The recreational boat and yacht market is highly fragmented, so M&A deals are an effective way to sustain growth. MarineMax managers have successfully pursued this strategy. Between April 2019 and October 2022, the company made 12 acquisitions, which are shown in the infographic below. In December, the company announced another deal.
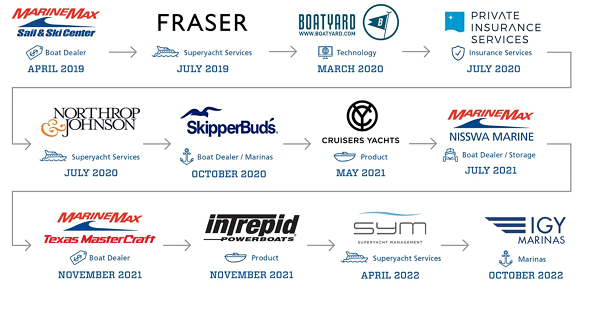
MarineMax began expanding its bay business in October, closing the acquisition of IGY Marinas, which expanded its global network of bays by 23 sites in North and South America, the Caribbean and Europe. It is worth noting that the bays acquired are located in the most popular destinations for yachting and sport fishing. This destination will provide year-round maintenance and repair services for both conventional and luxury yachts. Then, in early December, it was announced that it was already taking over Midcoast Marine Group, a full-service seaport construction company. This acquisition will further expand MarineMax's service portfolio and may contribute to the vertical integration of the company's business processes.
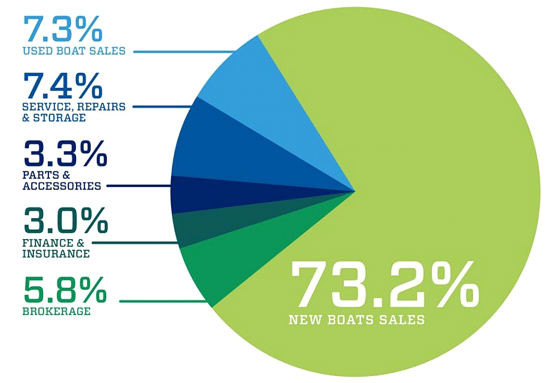
M&A activity not only helps support the company's inorganic growth, but also helps diversify its revenue streams. Between 2015 and 2022, MarineMax was able to increase the share of its high-margin business from 15.8% to 19.5%. This result was achieved mainly by reducing the share of the used boat sales business and increasing the service business. However, new boat and yacht sales still remain the company's key business with a 73.2% share.
MarineMax's key advantage among companies targeting inorganic growth is efficient financial management: MarineMax has been able to maintain a healthy balance sheet and financial strength since 2021: net debt is in the negative range at a fairly aggressive pace of acquisitions.
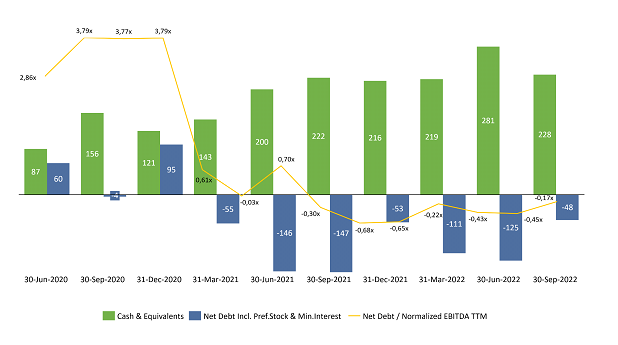
Data source: Refinitiv, $ million
In addition, MarineMax announced the creation of a new business, New Wave Innovations, which will invest in and develop technology products and services. The new division will include Boatyard, acquired in March 2020 (recognised in October 2021 as the leading company in terms of innovation in the marine industry) and Boatzon (a definitive agreement to acquire the remaining 75% stake, until then not owned by MarineMax, was concluded on 7 December). Initially, this business will require some investment and therefore pose some risks, but if successful, it will bring the company significant profits and open up new avenues for development.
Reason 2. Market potential
The main risk remains the deterioration of the macroeconomic environment and the emergence of a recession. However, MarineMax management has a successful track record of getting through stressful situations. The closest example is the economic downturn during Covid-19. As can be seen from the chart below, the company even better in 2020 than it did in 2019.
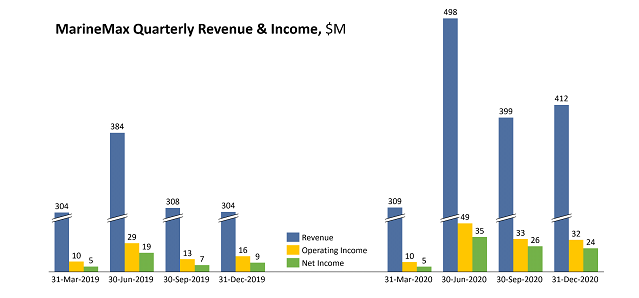
Source: Refinitiv
Financial indicators
The company's results for the last 12 months:
TTM revenue: up from $2.06bn to $2.31bn
TTM operating profit: up from $209.5m to $265.2m
in terms of operating margins, up from 10.2% to 11.5% due to the increased presence of high-margin businesses in the product mix
TTM net profit: up from $155m to $198m
in terms of net margin, up from 7.5% to 8.6%
Operating cash flow: down from $373.9m to $76.6m due to investment in inventory
Free cash flow: down from $347.8m to $18.1m
Based on the results of the most recent reporting period:
Revenue: up from $462.3m to $536.8m
Operating profit: up from $43.7m to $50.9m:
in terms of operating margins - unchanged at 9.5%
Net income: up from $32.8 million to $38.4 million
in terms of net margin - virtually unchanged: up from 7.1% to 7.2%
Operating cash flow: down from $44.3m to $46.4m due to investment in inventory
Free cash flow: down from $36.6m to $61.8m
MarineMax has performed well financially, given that its inorganic growth strategy emphasises growth through acquisitions, which contributes to the company's rapid growth, but carries higher risks. The main risk is a weak balance sheet due to a higher debt load. However, MarineMax has no such problem.
- Cash and cash equivalents: $228.3 million
- Net debt: $48 million
Negative net debt allows the company to feel financially stable and continue to invest to maintain high growth.
Evaluation
One important reason for MarineMax's attractiveness is its valuation by major multiples. In general, recreational boat and yacht companies are currently valued cheaply, although they are showing moderate growth rates. The main reason for this is recession expectations, but if the situation improves companies in this area could show significant growth. Separately, MarineMax Inc. is undervalued relative to its competitors by all measures.
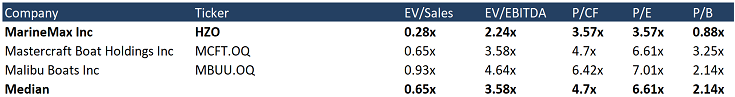
Source: Refinitiv
Ratings of other investment houses
The minimum price target set by B. Riley's minimum price target is $35 per stock. Raymond James, in turn, set a target price of $55 per stock. According to the consensus, the fair value of the stock is $44.7 per stock, which implies a 54.32% upside potential.
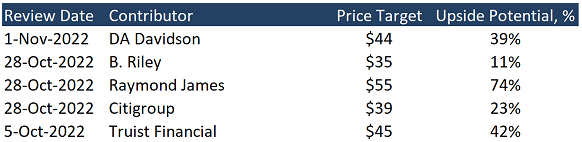
Source: Marketbeat
Key risks
- In the event of a serious recession, even segments of luxury goods may come under pressure due to declining demand.
- A growth-by-acquisition strategy carries the risk of a failed M&A deal, which could have a negative impact on the company's value.
Sources of information
- https://s28.q4cdn.com/795129223/files/doc_financials/2022/q4/MarineMax_RoadShow_Q4-and-Fiscal-2022-FINAL.pdf
- https://www.alliedmarketresearch.com/luxury-yacht-market
- https://www.grandviewresearch.com/industry-analysis/global-leisure-boat-market
- https://investor.marinemax.com/news/news-details/2022/MarineMax-Reports-Record-Fourth-Quarter-and-Fiscal-Year-2022-Results/default.aspx
- https://s28.q4cdn.com/795129223/files/doc_financials/2022/q4/39f011e0-0fa8-4cc4-9c86-f028303378c0.pdf
- https://investor.marinemax.com/news/news-details/2022/MarineMax-Significantly-Expands-Global-Marina-Business-with-the-Closing-of-IGY-Marinas/default.aspx
- https://investor.marinemax.com/news/news-details/2022/MarineMax-Acquires-Marine-Development-Company/default.aspx
- https://investor.marinemax.com/news/news-details/2022/MarineMax-Expands-Technology-Investments-Through-New-Wave-Innovations/default.aspx
- https://www.marinemax.com/connect/lifestyles/press-releases/2022/october/boatyard-recognized-as-a-leading-innovative-company
Recommendation Evaluation Methodology
Lion Capital Group analysts perform a three-stage analysis. They select a promising industry based on the latest news, statistics and industry-specific metrics. They assess the supply and demand situation and its future development dynamics. Industry’s investment attractiveness is mostly affected by the forecasted market growth rates; total addressable market, player concentration level and likeliness of a monopoly formation, as well as the level of regulation by various entities or associations.
The assessment is followed by the comparative analysis based on the selected sample. The sample comprises companies with a market capitalization of over USD 1 billion, but there is space for exceptions (when the suitable level of liquidity for company’s securities is available on the stock exchange). The selected companies (peers) are being compared against each other based on multipliers (EV/S, EV/EBITDA, PE, P/FCF, P/B), revenue growth rates, marginality and profitability (operating income margin, net income margin, ROE, ROA), and business performance.
Having completed the comparative analysis, the analysts carry out a more in-depth research of the news about the selected company. They review company’s development policy, information about its current and potential mergers and acquisitions (M&A activity), and assess the efficiency of company's inorganic growth and other news about it over the past year. The main objective at this stage is to identify the growth drivers and evaluate their stability, as well as the extent of impact they have on the business.
Based on all the data collected, the analysts determine the weighted forecasted figures of company’s growth rates and proposed business marginality, which are used to calculate the company’s multiplier-based estimated value. The said value enables setting the stock price target and stock value growth potential.
The expected timing of the idea implementation is set depending on the current market situation, volatility level and available forecasting horizon for industry and company development. The forecasting period is normally set between 3 and 12 months.
Disclaimer
Information and analytical services and materials are provided by Lion Capital Group as part of the services specified and are not an independent activity. The Company reserves the right to refuse service to persons not meeting the criteria for clients, or those subject to bans / restrictions on such services in accordance with the European Union laws. Restrictions may also be imposed by the internal procedures and controls of Lion Capital Group. Lion Capital Group provides financial services in the European Union in accordance with license CIF 275/15 for all types of activities required by the company as granted by the Cyprus Securities and Exchange Commission (CySEC) on 20.05.2015. Disclaimer: Additional information is available upon request. Investing in securities and other financial instruments always involves the risk of capital loss. The client must personally acknowledge this, including by reading the Risk Disclosure Notice. Opinions and estimates represent our judgments as of the date hereof and are subject to change without notice. Fees, charges and other expenses may reduce the financial performance of your investment. Past returns do not guarantee future returns. This material is not intended to be an offer or solicitation to buy or sell any financial instrument. The opinions and recommendations provided herein do not consider any individual circumstances, goals or needs of the client and do not constitute an investment advisory service. Recipients of this report must make their own independent decisions in relation to any securities or financial instruments referred to herein. The information has been obtained from sources that Lion Capital Group believes to be reliable; its affiliates and/or subsidiaries (jointly referred to as Lion Capital Group) do not guarantee completeness or accuracy of such information, save for disclosures related to Lion Capital Group and/or its affiliates/agents and analyst's interactions with the issuer being the subject of research. All prices provided are indicative closing prices for the securities in question, unless otherwise specified.
Terms and conditions of market research use
Company income statement
| 2023 | |
|---|---|
| Revenue | 2 308.10M |
| EBITDA | 284.62M |
| Net Income | 197.99M |
| Net Income Ratio | 8.58% |
Financial strength
| 2023 | |
|---|---|
| Debt/Eq | 72.84% |
| FCF Per Share | 0.82 |
| Interest Coverage | 80.78 |
| EPS | 9.00 |
| Payout ratio | 0.00% |
Management efficiency
| 2023 | |
|---|---|
| ROAA | 14.64% |
| ROAE | 25.30% |
| ROI | 28.21% |
| Asset turnover | 1.71 |
| Inventory turnover | 3.31 |
| Receivables turnover | 45.90 |
Margin
| 2023 | |
|---|---|
| Gross Profit Margin | 34.91% |
| Net Profit Margin | 8.58% |
| Operating Profit Margin | 11.49% |