Why do we like Park Hotels & Resorts Inc.?
Reason 1. Recovery of the hospitality industry
The Covid-19 pandemic and related restrictions on cross-border and local travel have dealt a devastating blow to the hospitality industry. However, pent-up demand and low-base effects have provided hotel companies with a recovery momentum that allows them to weather the current headwinds of tighter monetary policy and consumer spending compression relatively unscathed.
According to the US Transportation Security Administration, the number of travellers crossing the country's borders daily in autumn 2022 was 195.98 million, up 18% from a year earlier, but still 5.7% below the comparable period in 2019. Air passenger traffic also continues to grow steadily and in October narrowed the gap from 2019 to 5%.
.png)
Number of travellers crossing US borders; source: compiled by the author
About half of Park Hotels' EBITDA comes from three regions: Hawaii, San Francisco and Orlando, which are experiencing a steady recovery. In Hawaii, for example, passenger traffic in November 2022 was 827,670, up 15.6% from a year earlier, but still 5.2% lower than in pre-dawn 2019. The number of passengers at Orlando International Airport has increased by 49.3% in the past 12 months and at San Francisco Airport by 55.3%.
These trends have already had an impact on the performance of the hospitality industry. According to STR data, Revenue Per Available Room (RevPAR) at US hotels rose 14% on 2019 levels to $104.59 and Average Daily Rate (ADR) rose 16.8% to $155.63.
.png)
Main indicators of the hospitality industry; source: compiled by the author
However, the occupancy rate is still 2.4% lower than the pre-pandemic 2019 rate of 67.2%. In Hawaii, the figure reached 77.4% in Q3 2022 compared to 82.6% in 2019. In San Francisco, occupancy is 19% below pre-pandemic levels. Orlando has become one of the few "successful" cities, there the rate increased by 1.9% for 2019 to 73.6%.
In our view, the current hospitality market environment is providing companies with a significant tailwind. When occupancy returns to 2019 levels, overall hotel company performance will exceed pre-pandemic levels, as RevPAR and ADR are already higher than in 2019 and PwC forecasts that they will continue to grow in 2023.
Reason 2. Deleveraging as a growth driver
While the Nuveen Short-Term REIT ETF, which has wide exposure to hotel property trusts, has recovered most of its value, Park Hotels is still trading well below sub-annuity levels and at a significant discount to net asset value.
Thus, unlike most industry players, the company can provide its clients with comprehensive solutions that consider their needs at all stages and allow TELUS to consider changing trends as the firm evolves. The ability to provide complex solutions makes the company attractive to large enterprises that prefer to deal with a single supplier capable of offering a "package deal" and ensuring business continuity. As such, TELUS has a significant advantage over its competitors.
.png)
PK and Nuveen Short-Term REIT ETF dynamics; source: TradingView
The discount is due to Park Hotels' high debt burden. Investors are concerned about potential dilution of shareholder shares to meet creditors' demands. As of end-September, the company had total debt of $4.67 billion and net debt of $3.67 billion. In our view, high financial leverage should not be a problem for Park Hotels. Moreover, we expect the deleveraging and rebalancing of the balance sheet to increase the company's stock price.
First, the current cash balance is sufficient to cover all debt maturities up to and including 2024. If the company extends its credit line by $900 million until 2027, according to management's plans, it will be able to cover its 2025 obligations as well.
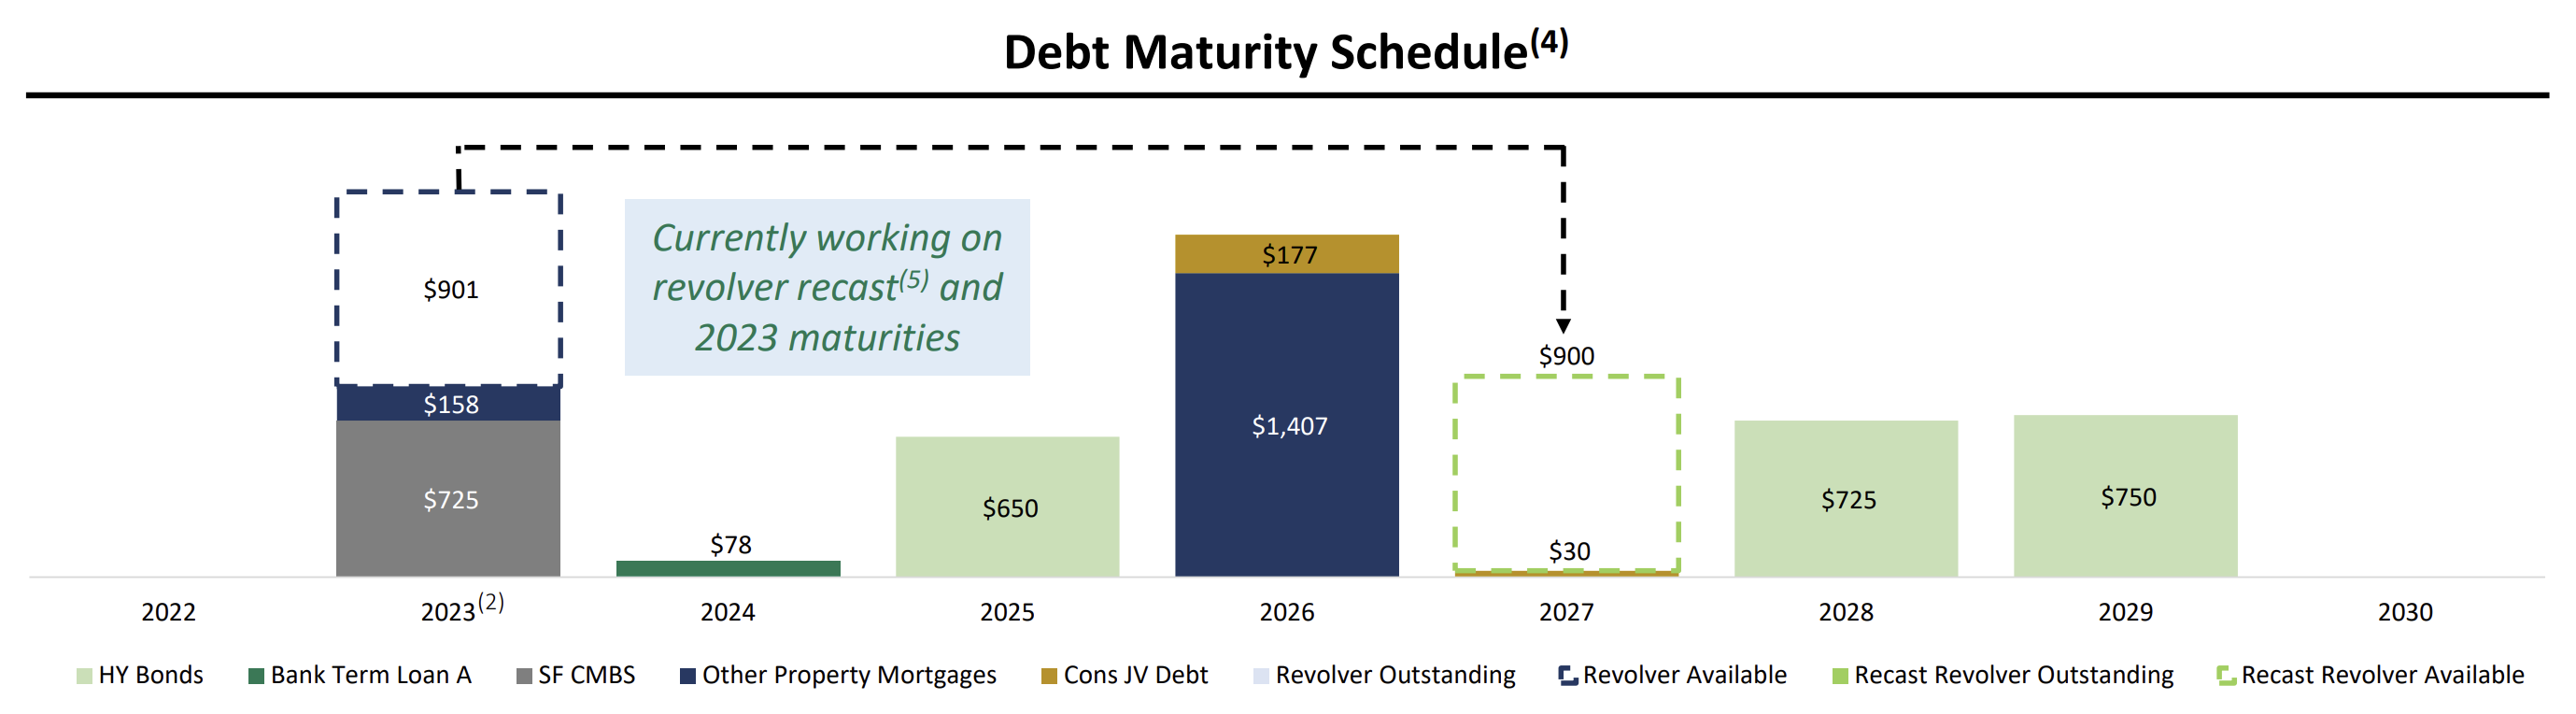
Debt maturity of Park Hotels; source: Company Presentation
Second, Park Hotels has suspended its dividend policy for 2020 and the current payouts are insignificant and more of a symbolic nature. The company is showing positive and growing cash flow, which will allow it to service its liabilities. It is worth noting that 98% of the firm's liabilities have a fixed rate of 5.04%, which minimises the impact of monetary policy on financial stability.
Third, the net worth of the company's properties (net of accumulated depreciation) is $8.29 billion. Net debt accounts for only 44.3% of net real estate value. It is worth noting that, under GAAP, Park Hotels depreciates properties using standard methods, while their market value increases over time. The gross value of the properties (excluding accumulated depreciation) is $10.95 billion, which is more in line with market values. Thus, net debt represents only 33.5% of the value of the property portfolio.
Reason 3. Buyback
Further supporting our view of Park Hotels' resilience is the fact that the company has repurchased $218 million worth of shares in the last nine months, thus realising the majority of the $300 million buyback programme approved in February.
Some investors would prefer to see a bond buyback. However, the company's weighted average cost of debt is significantly lower than its cost of equity, and given that Park Hotels trades at a discount to book value, a buyback at current prices has a high internal rate of return.
Financial indicators
Against the backdrop of a recovery in the hospitality industry, Park Hotels is showing steady improvement in operational and financial metrics. However, a number of metrics still remain significantly below pre-pandemic levels, providing the company with the potential for further recovery growth. The nine months of 2022 versus the comparable period in 2019 are shown below:
- RevPAR: $154.21 versus $178.73.
- Occupancy: 64.8% vs. 80.5%.
- ADR: $238.16 vs $221.89
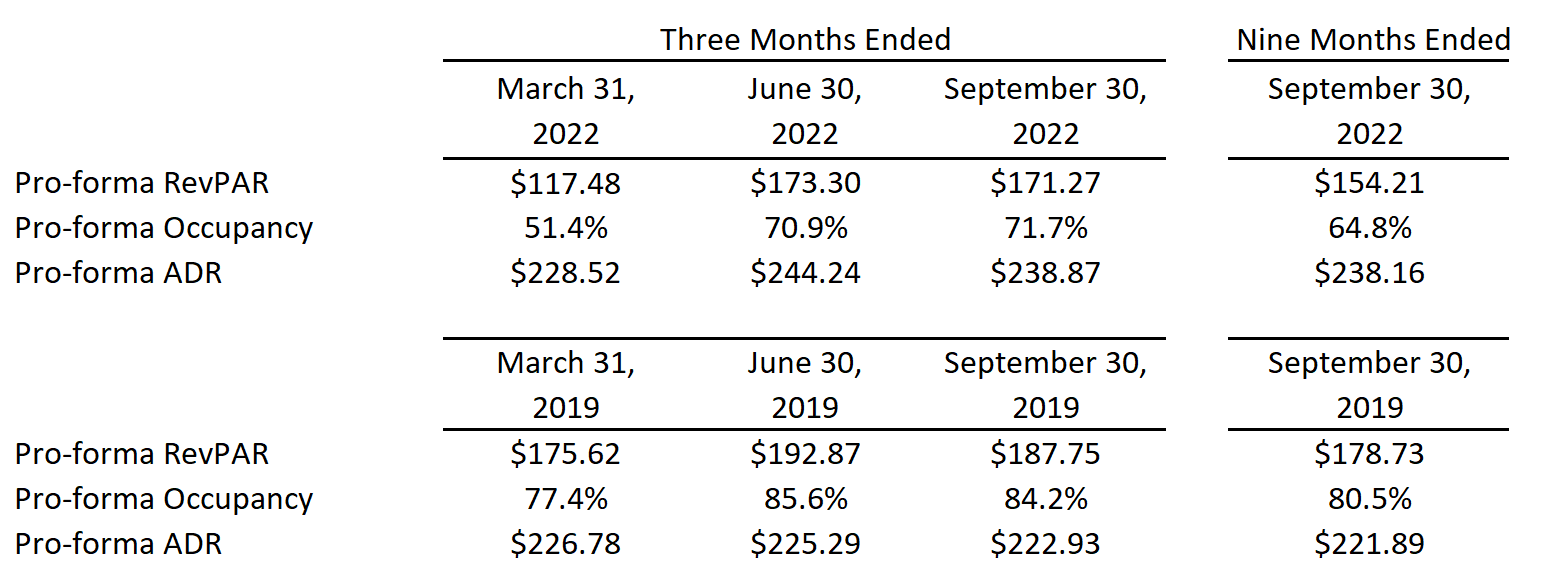
Operational and financial metrics; source: compiled by the author
The company's results for the past 12 months can be summarised as follows
- TTM revenue was $2.29 billion, a 67.9% increase on the 2021 results.
- Adjusted EBITDA increased from $142 million to $528 million. Adj. EBITDA margin increased from 10.43% to 23.09%.
- Net profit was $66 million compared to -$459 million at the end of the year. Net margin rose from -33.70% to 2.89%.
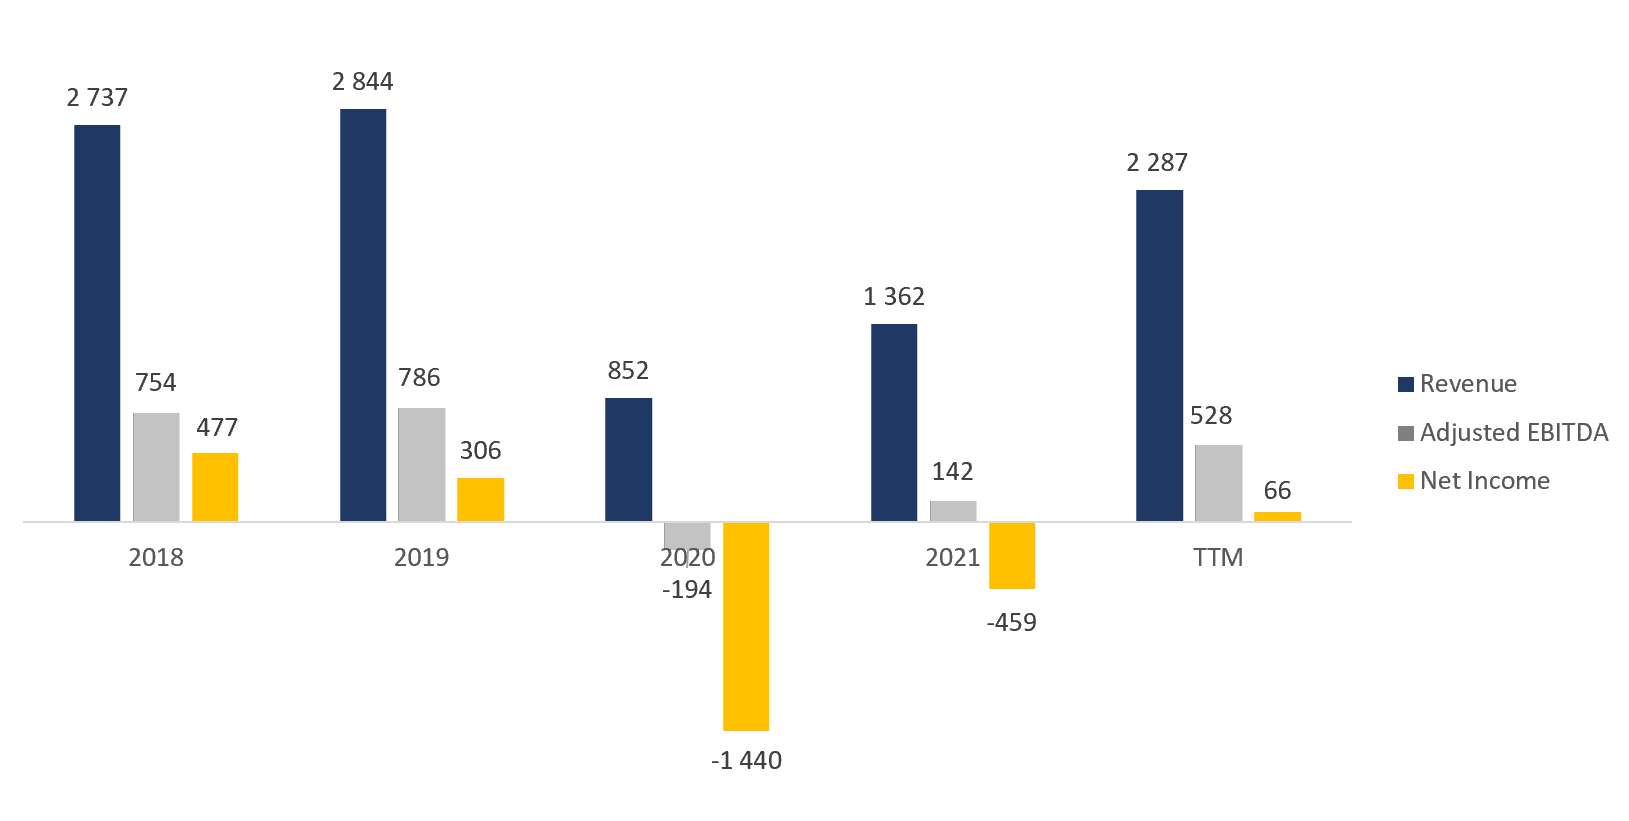
Trends in the company's financial results; source: compiled by the author
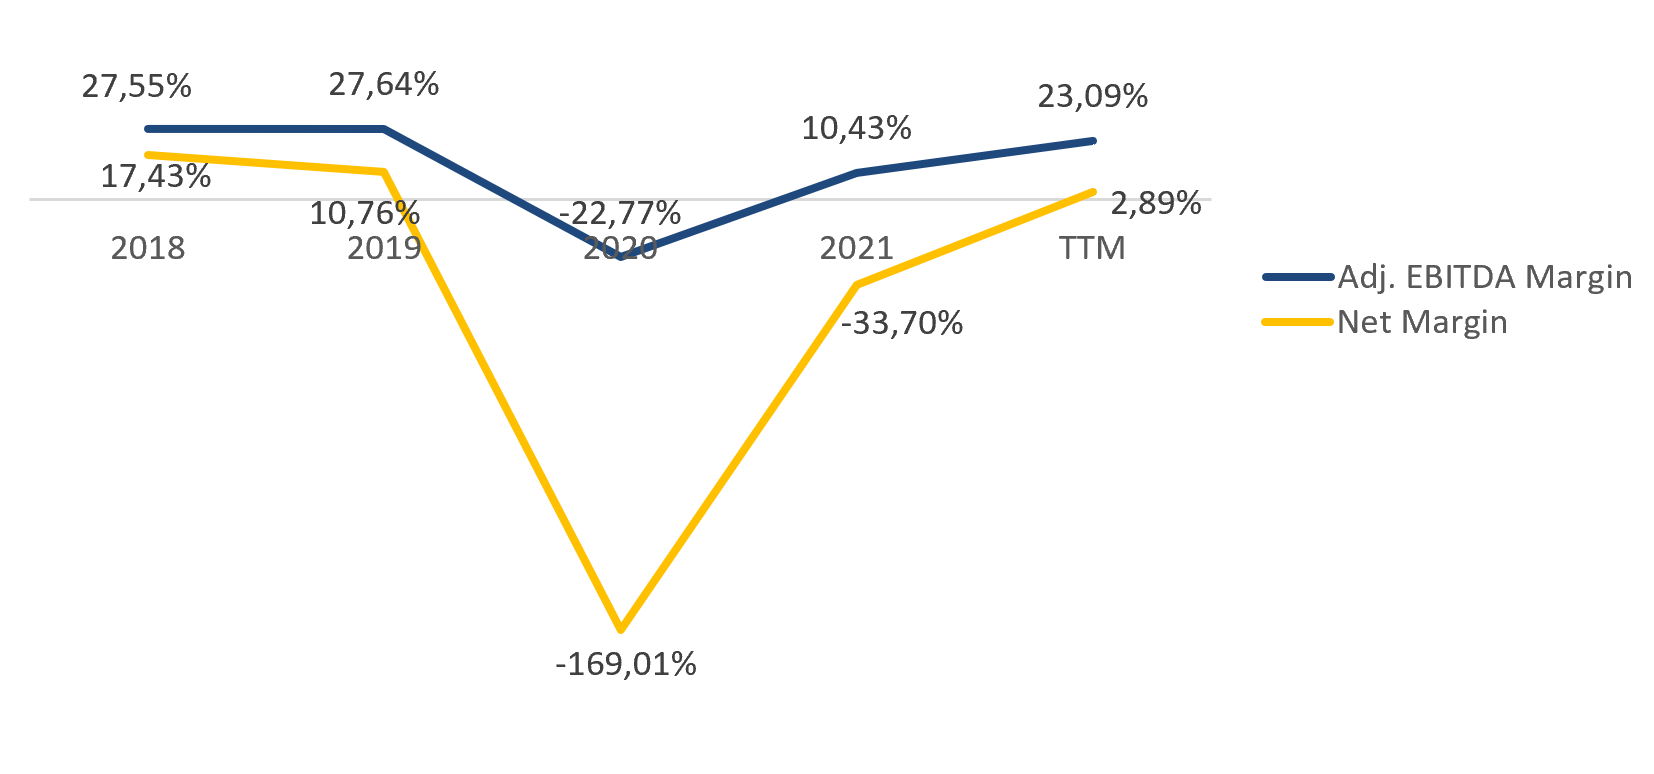
Company margin dynamics; source: compiled by the author
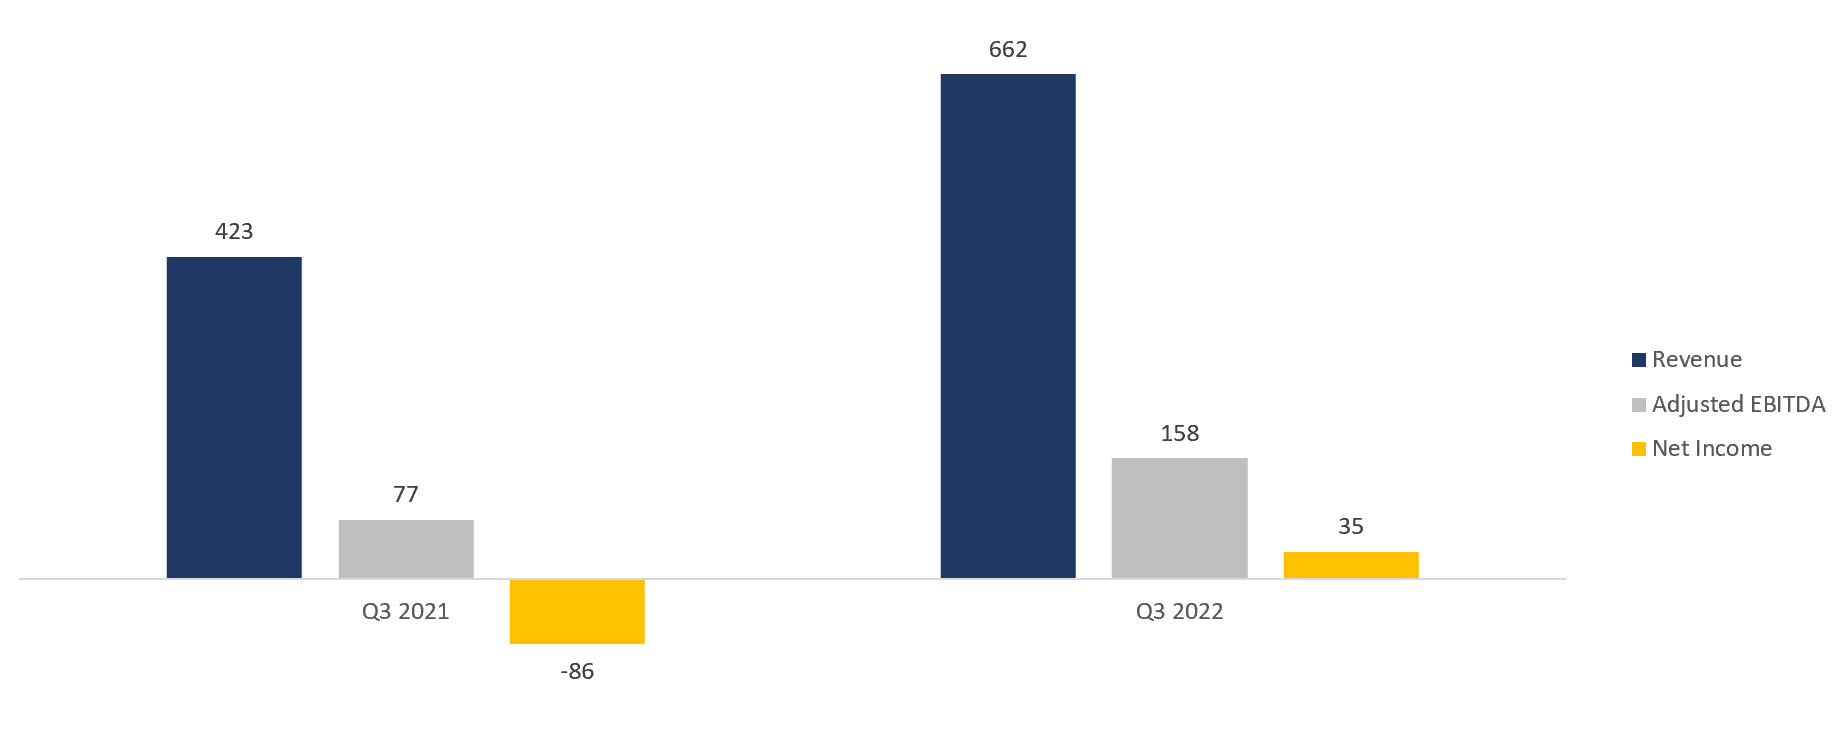
The financial results for Q3 2022 are as follows
- Revenue rose 56.5% year on year, from $423 million to $662 million.
- Adjusted EBITDA increased from $77 million to $158 million Adj. EBITDA margin increased from 18.20% to 23.87%.
- Net profit was $35 million compared to -$86 million a year earlier. Net margin increased from -20.33% to 5.29%.
Trends in the company's financial results; source: compiled by the author
Net income is not a fully representative measure of the performance of real estate investment trusts. GAAP/IFRS standards require all REITs to depreciate their properties over time using one of the standard depreciation methods, while the value of many investment properties increases over time. Funds From Operations (FFO) compensates for cost accounting methods that may not accurately reflect the true performance of a REIT.
At the end of the latest reporting period, TTM FFO was $261 million, compared with -$136 million at the end of the year.
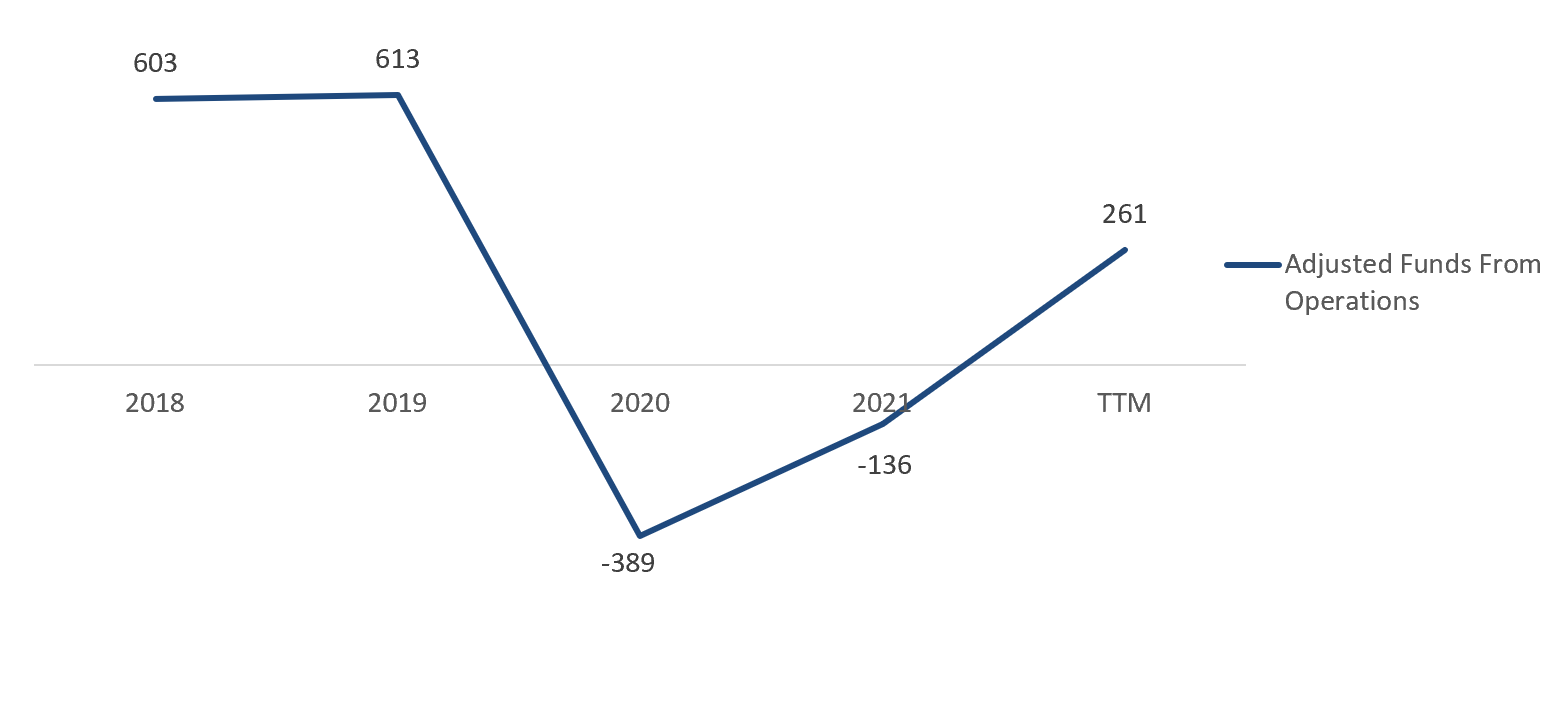
Cash flow from Park Hotels operations; source: compiled by the author
As noted earlier, Park Hotels has a relatively high debt load. However, in our view, the high financial leverage should not be a problem for the company. Its total debt is $4.67 billion, cash equivalents and short-term investments account for $1 billion and net debt is $3.67 billion, which is 6.95x TTM Adj. EBITDA (Net debt/EBITDA — 6.95x). The interest expense coverage ratio is 2.13x.
Evaluation
Park Hotels trades at a discount to the industry average: EV/Sales — 2.84x, EV/EBITDA — 13.53x, P/FFO — 8.44x, P/B — 0.65x. In addition, the company has a better FFO yield than its peers: FFO yield of 11.8%.
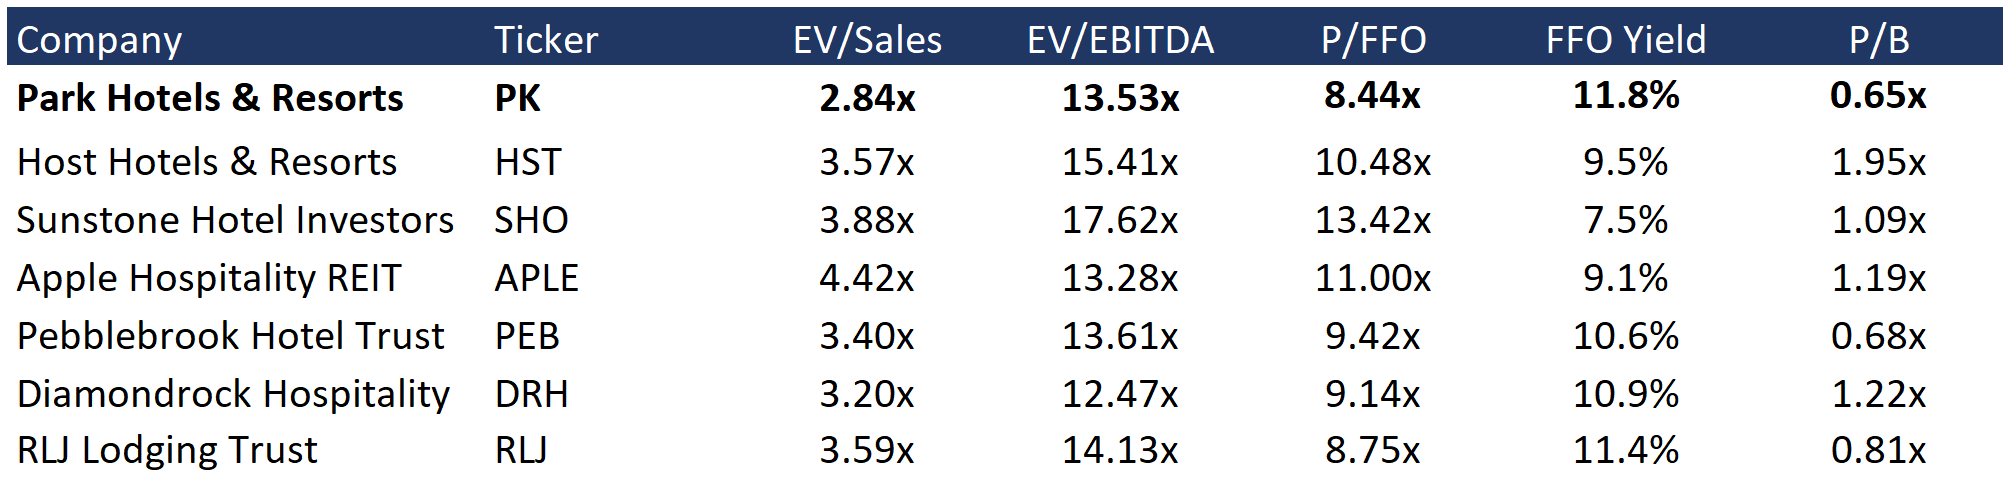
Comparable estimate; source: compiled by the author
The minimum price target from investment banks set by SMBC Nikko is $12 per share. Compass Point, on the other hand, values PK at $25 per share. According to the consensus, the fair market value of the stock is $18.50 per share, which implies a 46.5% upside potential.
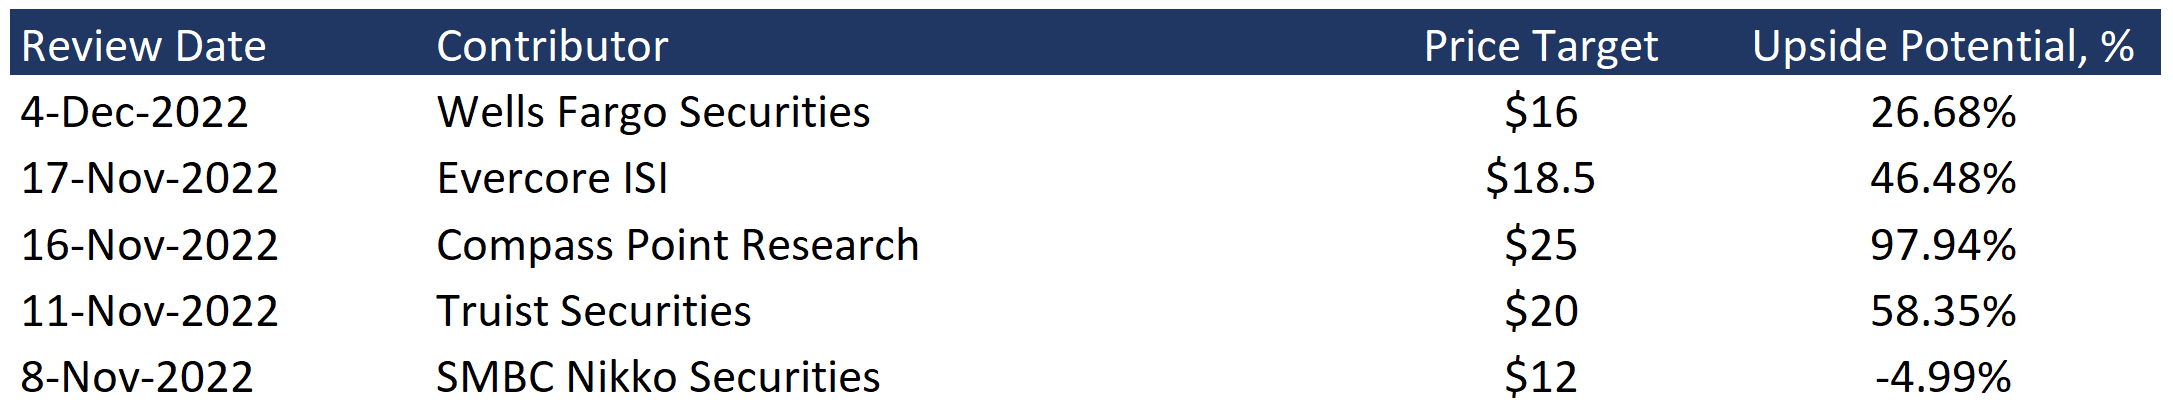
Price targets of investment banks; source: compiled by the author
Key risks
- A number of US cities are experiencing another spike in the incidence of Covid-19. Although we consider the likelihood of any restrictions to be extremely low, it is worth considering this risk when making investment decisions.
- The high debt burden makes Park Hotels more susceptible to external shocks. Whether it is the imposition of restrictions or reduced demand due to macroeconomic uncertainty, the company will find it much harder to get through tough times than its less indebted competitors.
Sources of information
- https://www.tsa.gov/travel/passenger-volumes
- https://www.ustravel.org/research/monthly-travel-data-report
- https://files.hawaii.gov/dbedt/economic/data_reports/special/total/Total-Nov22.pdf
- https://www.flysfo.com/sites/default/files/2022-10/as082022.pdf
- https://www.bizjournals.com/orlando/news/2022/10/03/florida-orlando-international-airport-passengers.html
- https://str.com/press-release/str-us-hotel-performance-october-2022
- https://dbedt.hawaii.gov/economic/qser/tourism/#:~:text=In%20the%20third%20quarter%20of%202022%2C%20the%20statewide%20hotel%20occupancy,(Table%20D%2D15).
- https://www.hawaiitourismauthority.org/media/4088/hawaii-timeshare-quarterly-survey-q3-2019.pdf
- https://www.costar.com/article/2029445112/str-us-hotel-occupancy-falls-but-rate-increases-remain-high
- https://www.businesstravelnews.com/Procurement/PwC-Headwinds-Threaten-2023-US-Hotel-Recovery-Pace
- https://www.pkhotelsandresorts.com/~/media/Files/P/Park-Hotels/reports-and-presentations/nareit-november-2022.pdf
- https://www.pkhotelsandresorts.com/~/media/Files/P/Park-Hotels/reports-and-presentations/q3-2022-financial-supplement-data.pdf
- https://otp.tools.investis.com/clients/us/park_hotels_p2/SEC/sec-show.aspx?FilingId=15605612&Cik=0001617406&Type=PDF&hasPdf=1
- https://otp.tools.investis.com/clients/us/park_hotels_p2/SEC/sec-show.aspx?FilingId=13959406&Cik=0001617406&Type=PDF&hasPdf=1
- https://otp.tools.investis.com/clients/us/park_hotels_p2/SEC/sec-show.aspx?FilingId=15585265&Cik=0001617406&Type=PDF&hasPdf=1
- https://www.sfchronicle.com/health/article/COVID-in-California-live-updates-17624808.php
Recommendation Evaluation Methodology
Lion Capital Group analysts perform a three-stage analysis. They select a promising industry based on the latest news, statistics and industry-specific metrics. They assess the supply and demand situation and its future development dynamics. Industry’s investment attractiveness is mostly affected by the forecasted market growth rates; total addressable market, player concentration level and likeliness of a monopoly formation, as well as the level of regulation by various entities or associations.
The assessment is followed by the comparative analysis based on the selected sample. The sample comprises companies with a market capitalization of over USD 1 billion, but there is space for exceptions (when the suitable level of liquidity for company’s securities is available on the stock exchange). The selected companies (peers) are being compared against each other based on multipliers (EV/S, EV/EBITDA, PE, P/FCF, P/B), revenue growth rates, marginality and profitability (operating income margin, net income margin, ROE, ROA), and business performance.
Having completed the comparative analysis, the analysts carry out a more in-depth research of the news about the selected company. They review company’s development policy, information about its current and potential mergers and acquisitions (M&A activity), and assess the efficiency of company's inorganic growth and other news about it over the past year. The main objective at this stage is to identify the growth drivers and evaluate their stability, as well as the extent of impact they have on the business.
Based on all the data collected, the analysts determine the weighted forecasted figures of company’s growth rates and proposed business marginality, which are used to calculate the company’s multiplier-based estimated value. The said value enables setting the stock price target and stock value growth potential.
The expected timing of the idea implementation is set depending on the current market situation, volatility level and available forecasting horizon for industry and company development. The forecasting period is normally set between 3 and 12 months.
Disclaimer
Information and analytical services and materials are provided by Lion Capital Group as part of the services specified and are not an independent activity. The Company reserves the right to refuse service to persons not meeting the criteria for clients, or those subject to bans / restrictions on such services in accordance with the European Union laws. Restrictions may also be imposed by the internal procedures and controls of Lion Capital Group. Lion Capital Group provides financial services in the European Union in accordance with license CIF 275/15 for all types of activities required by the company as granted by the Cyprus Securities and Exchange Commission (CySEC) on 20.05.2015. Disclaimer: Additional information is available upon request. Investing in securities and other financial instruments always involves the risk of capital loss. The client must personally acknowledge this, including by reading the Risk Disclosure Notice. Opinions and estimates represent our judgments as of the date hereof and are subject to change without notice. Fees, charges and other expenses may reduce the financial performance of your investment. Past returns do not guarantee future returns. This material is not intended to be an offer or solicitation to buy or sell any financial instrument. The opinions and recommendations provided herein do not consider any individual circumstances, goals or needs of the client and do not constitute an investment advisory service. Recipients of this report must make their own independent decisions in relation to any securities or financial instruments referred to herein. The information has been obtained from sources that Lion Capital Group believes to be reliable; its affiliates and/or subsidiaries (jointly referred to as Lion Capital Group) do not guarantee completeness or accuracy of such information, save for disclosures related to Lion Capital Group and/or its affiliates/agents and analyst's interactions with the issuer being the subject of research. All prices provided are indicative closing prices for the securities in question, unless otherwise specified.
Terms and conditions of market research use
Company income statement
| 2023 | |
|---|---|
| Revenue | 1 362.00M |
| EBITDA | 82.00M |
| Net Income | -459.00M |
| Net Income Ratio | -33.70% |
Financial strength
| 2023 | |
|---|---|
| Debt/Eq | 119.95% |
| FCF Per Share | -0.81 |
| Interest Coverage | -0.69 |
| EPS | -1.95 |
| Payout ratio | 0.00% |
Management efficiency
| 2023 | |
|---|---|
| ROAA | -4.71% |
| ROAE | -10.31% |
| ROI | -1.90% |
| Asset turnover | 0.14 |
| Receivables turnover | 14.19 |
Margin
| 2023 | |
|---|---|
| Gross Profit Margin | 21.00% |
| Net Profit Margin | -33.70% |
| Operating Profit Margin | -13.14% |