Why do we like SEMrush Holdings, Inc.?
Reason 1. Prospects for industry recovery
Tools to help engage potential customers through social media, search services and online venues are essential for any forward-thinking business in 2022. And the rapid pace at which search engines are improving requires companies to constantly review the effectiveness of the tools they use and adapt their approaches when necessary. There are many different individual offerings on the market, but Semrush offers all the necessary tools and solutions.
The current macroeconomic turbulence is putting pressure on the business, which is reflected in Semrush's financial results, further compounded by the company's increased costs associated with the relocation of employees from Russia. All this is affecting the stock price, which has fallen by 60% since the beginning of the year. But, as we know, as risks increase, so does the potential return on investment. And we believe investors will be able to get it in 2023.
- Inflation continues to decelerate faster than expected with the consumer price index falling to 7.1% from a peak of 9.1%. A further decline in the index would encourage the Fed to ease policy, which would be a stimulus for the economy.
- Two independent agencies (IAB and Matter Communications) conclude that most companies plan to increase their marketing spend in 2023. The IAB estimates that total advertising spend will increase by 5.9% year-over-year, and 63% of those surveyed plan to revise media plans more frequently (most on at least a monthly basis). Semrush offers suitable analytics tools on which to base this work. That said, the top 3 areas that Matter Communications says it plans to allocate marketing budgets to in 2023 can be covered by Semrush Holdings' solutions.
The long-term outlook for the direction also remains: ResearchAndMarkets forecasts the global SEO market to grow at a compound annual growth rate (CAGR) of 9.8% through 2028. Based on the number of companies in the United States and the annual recurring revenue (ARR) generated by clients in their respective segments, Semrush management estimates the global market opportunity for the company at $16 billion with a forecast to increase this value to over $20 billion in the future. Thus, the company has huge growth potential.
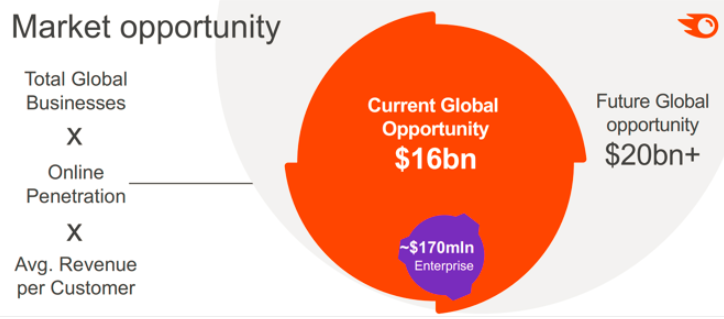
Source: Semrush Investor Presentation
Reason 2. Maintaining company growth and effective customer retention
Semrush is showing good customer base growth — the number of customers increased by 17% quarter-on-quarter in Q3, partially offsetting a temporary decline in ARR growth by customer due to macroeconomic factors. The historical data in the chart below shows that despite the challenges, the company is growing revenue rapidly, with a CAGR of around 41% on the 2018-2022 horizon (including Q4 forecasts).
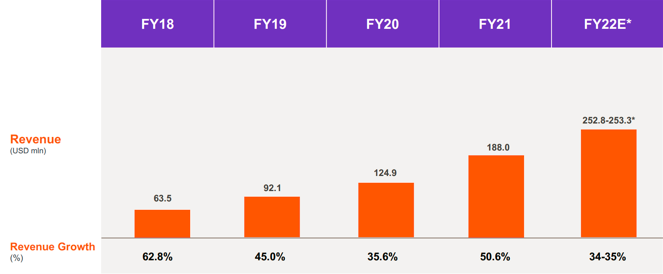
Source: Semrush Investor Presentation
Note that in the more challenging years (2020 and 2019), the revenue growth rate decreased markedly. Semrush's net revenue retention rate (NRR, the percentage of recurring revenue retained from existing customers over a given time period) is 122%, meaning that revenue from existing customers is increasing. In our view, the company is well positioned to increase this figure in 2023 by increasing ARR on the customer base it has already accumulated this year, which in a positive market scenario could increase marketing spend.
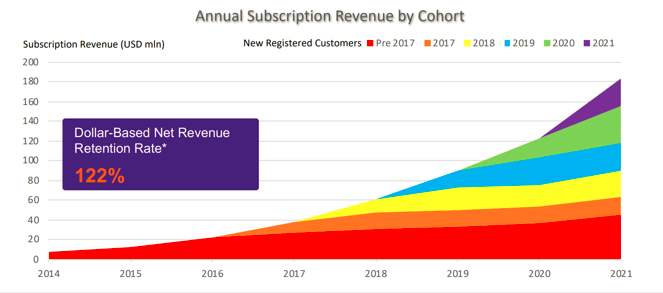
Source: Semrush Investor Presentation
The fact that Semrush, despite its small size, works with major clients, including Disney, Ebay, Salesforce and others, can also help to attract new clients. Thus, the company is actively building up its level of trust, which will subsequently help to further attract new large clients.
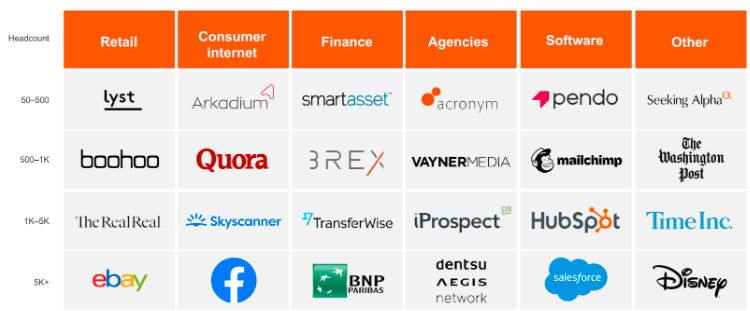
Source: Semrush Investor Presentation
Meanwhile, for clients at a time of shrinking advertising budgets, Semrush launched a beta version of the Content Outline Builder tool over the summer, allowing clients to save time and money in content production. This can further expand the client base and lay the foundation for future ARR growth by moving clients to paid plans.
Financial indicators
TTM revenue: up from $170.7 million to $239.3 million
TTM operating profit: down from $0.7 million to $24.8 million
in terms of operating margins, decrease from 0.4% to -10.4% due to an increase in SG&A expenses from 63.3% to 71.8%
TTM net profit: down from -$0.2 million to -$23.8 million
in terms of net margin, down from -0.1% to -9.9%
Operating cash flow: down from $23.8 million to $5 million due to lower profit base
Free cash flow: down from $20 million to $2.1 million
Based on the results of the most recent reporting period:
Revenue: up from $49.3 million to $65.8 million
Operating profit: down from -$0.3 million to -$10.3 million
in terms of operating margins, down from -0.7% to -15.6% mainly due to an increase in SG&A expenses from 65.1% to 72.3%
Net profit: down from -$0.6 million to -$9.1 million:
in terms of net margins, down from -1.3% to -13.8%
Operating cash flow: down from $8.7 million to -$0.6 million due to lower profit base
Free cash flow: down from $16.8 million to -$2.3 million
The company is experiencing temporary pressure on profitability due to macroeconomic difficulties translating into lower target market spending, as well as increased operating expenses for the relocation of staff from Russia. Nevertheless, the company's revenues continue to show good growth and free cash flows are not going into deep negative territory. We believe that the company can improve its performance next year, which will be reflected positively in Semrush Holdings' stock price.
- Cash and cash equivalents: $246.6
- Net debt: -$246.6 million
In the face of temporary deterioration in financial performance, it is important that the company's net debt is in the negative range and that there is enough cash and cash equivalents on the balance sheet to survive turbulent times without a noticeable decline in financial strength.
Evaluation
In terms of TTM trading multiples, the company is undervalued to its peers on EV/S and P/B, while the other multiples, like most peers, are in negative territory.
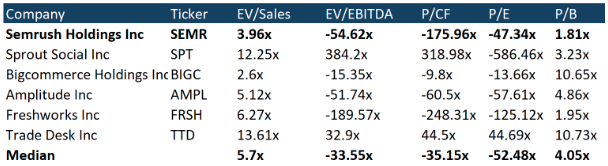
Source: Refinitiv
By the end of 2022, the company's management expects revenues in the range of $252.8-$253.3 million, which would indicate a year-on-year growth rate of 34%-35%. We believe the forecast is realistic given the current market conditions and do not expect significant deviations from expectations.
Ratings of other investment houses
The minimum price target set by Jeffries Financial Group is $10 per share. Stifel Nicolaus has in turn set a target price of $20 per share. According to the consensus, the fair value of the stock is $14.60 per share, which implies a 87.5% upside potential.
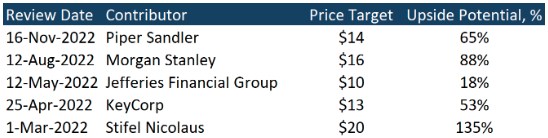
Source: Marketbeat
Key risks
- In the event of significant technological changes in search engines affecting the effectiveness of the solutions Semrush offers, the company will have to invest in the development of new algorithms.
- A further deterioration in the economic situation could significantly reduce the company's growth rate.
- Semrush's solutions depend in part on third-party data, an area where the company may face difficulties if additional regulation is introduced.
Sources of information
- https://investors.semrush.com/news/news-details/2022/Semrush-Announces-Third-Quarter-2022-Financial-Results/
- https://d18rn0p25nwr6d.cloudfront.net/CIK-0001831840/b93e59f1-e9b4-43d3-8810-51a4bebf99d9.pdf
- https://www.investing.com/economic-calendar/cpi-733
- https://www.researchandmarkets.com/reports/5623609/seo-market-size-share-trends-by-component-by
- https://s27.q4cdn.com/202248034/files/doc_presentations/2022/17/November-2022-Investor-Presentation.pdf
- https://investors.semrush.com/news/news-details/2022/Semrush-Launches-Beta-Version-of-Content-Outline-Builder-Expands-Listing-Management-Globally/default.aspx
Recommendation Evaluation Methodology
Lion Capital Group analysts perform a three-stage analysis. They select a promising industry based on the latest news, statistics and industry-specific metrics. They assess the supply and demand situation and its future development dynamics. Industry’s investment attractiveness is mostly affected by the forecasted market growth rates; total addressable market, player concentration level and likeliness of a monopoly formation, as well as the level of regulation by various entities or associations.
The assessment is followed by the comparative analysis based on the selected sample. The sample comprises companies with a market capitalization of over USD 1 billion, but there is space for exceptions (when the suitable level of liquidity for company’s securities is available on the stock exchange). The selected companies (peers) are being compared against each other based on multipliers (EV/S, EV/EBITDA, PE, P/FCF, P/B), revenue growth rates, marginality and profitability (operating income margin, net income margin, ROE, ROA), and business performance.
Having completed the comparative analysis, the analysts carry out a more in-depth research of the news about the selected company. They review company’s development policy, information about its current and potential mergers and acquisitions (M&A activity), and assess the efficiency of company's inorganic growth and other news about it over the past year. The main objective at this stage is to identify the growth drivers and evaluate their stability, as well as the extent of impact they have on the business.
Based on all the data collected, the analysts determine the weighted forecasted figures of company’s growth rates and proposed business marginality, which are used to calculate the company’s multiplier-based estimated value. The said value enables setting the stock price target and stock value growth potential.
The expected timing of the idea implementation is set depending on the current market situation, volatility level and available forecasting horizon for industry and company development. The forecasting period is normally set between 3 and 12 months.
Disclaimer
Information and analytical services and materials are provided by Lion Capital Group as part of the services specified and are not an independent activity. The Company reserves the right to refuse service to persons not meeting the criteria for clients, or those subject to bans / restrictions on such services in accordance with the European Union laws. Restrictions may also be imposed by the internal procedures and controls of Lion Capital Group. Lion Capital Group provides financial services in the European Union in accordance with license CIF 275/15 for all types of activities required by the company as granted by the Cyprus Securities and Exchange Commission (CySEC) on 20.05.2015. Disclaimer: Additional information is available upon request. Investing in securities and other financial instruments always involves the risk of capital loss. The client must personally acknowledge this, including by reading the Risk Disclosure Notice. Opinions and estimates represent our judgments as of the date hereof and are subject to change without notice. Fees, charges and other expenses may reduce the financial performance of your investment. Past returns do not guarantee future returns. This material is not intended to be an offer or solicitation to buy or sell any financial instrument. The opinions and recommendations provided herein do not consider any individual circumstances, goals or needs of the client and do not constitute an investment advisory service. Recipients of this report must make their own independent decisions in relation to any securities or financial instruments referred to herein. The information has been obtained from sources that Lion Capital Group believes to be reliable; its affiliates and/or subsidiaries (jointly referred to as Lion Capital Group) do not guarantee completeness or accuracy of such information, save for disclosures related to Lion Capital Group and/or its affiliates/agents and analyst's interactions with the issuer being the subject of research. All prices provided are indicative closing prices for the securities in question, unless otherwise specified.
Terms and conditions of market research use
Company income statement
| 2023 | |
|---|---|
| Revenue | 188.00M |
| EBITDA | 520 000.00 |
| Net Income | -3.29M |
| Net Income Ratio | -1.75% |
Financial strength
| 2023 | |
|---|---|
| Debt/Eq | 33.05% |
| FCF Per Share | 0.15 |
| EPS | -0.02 |
| Payout ratio | 0.00% |
Management efficiency
| 2023 | |
|---|---|
| ROAA | -1.09% |
| ROAE | -1.46% |
| ROI | -1.09% |
| Asset turnover | 0.63 |
| Receivables turnover | 85.85 |
Margin
| 2023 | |
|---|---|
| Gross Profit Margin | 77.69% |
| Net Profit Margin | -1.75% |
| Operating Profit Margin | -1.33% |