Why do we like Signature Bank?
Crypto-factor
In 2019, the bank launched its own blockchain-based payment solution, Signet. It connects institutional players in the cryptocurrency market into a single ecosystem and allows them to conduct transactions in real time, 24 hours a day, seven days a week. Signet has gained popularity and various crypto companies have started joining the platform: exchanges, depositories, mining firms, hedge funds and so on. Crypto-companies' assets have been placed in interest-free deposit accounts and are used by Signature in operational activities. In addition, the bank offers a loan product secured by cryptocurrency as part of Signature.
The Signet platform was a key factor in the stock's unrestrained rise in 2021, with the value momentarily hitting $366 apiece. However, it also served as a source of bearish sentiment in 2022. The stock has lost more than 60% since the start of the year and its correlation with bitcoin has reached 70%. The market fears that the declining value of cryptocurrencies will lead to a significant reduction in deposit accounts opened in the names of cryptocurrency companies.
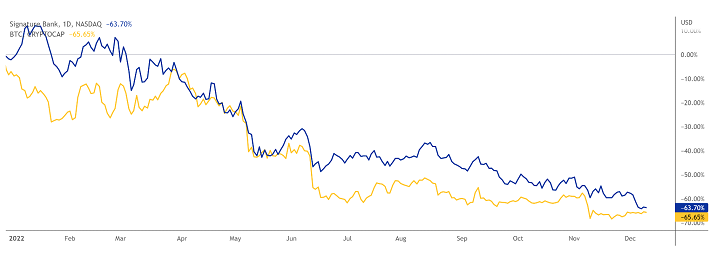
Correlation between SBNY stocks and bitcoin; source: TradingView
that the business model of commercial banks, which Signature is, is based on the interest rate differential between the cost of capital raised, which is reflected in the balance sheet liability, and the return on assets - loans and borrowings issued. If the balance sheet liability sharply decreases (e.g. because customers withdraw their deposits) and the assets have low liquidity, the bank may face financial difficulties. In Signature's case, however, the impact of cryptocurrencies is severely limited.
As of 31 December 2021, the company had only one digital asset-backed loan totalling $100 million on its balance sheet, compared with a total portfolio of loans and borrowings of $73.8 billion.
At the end of the last reporting period, Signature's total deposits were $102.8 billion, of which only $23.5 billion (22.9%) came from digital deposits. Assuming all cryptocurrencies leave the bank, which is highly unlikely, deposits would total $79.3 billion, still more than loans and advances. The current loan-to-deposit ratio (Loans-to-Deposits) is 71.8%; the figure adjusted for digital deposits is 93.1%. By comparison, throughout 2019, the loan-to-deposit ratio was between 96.4% and 101.6%.
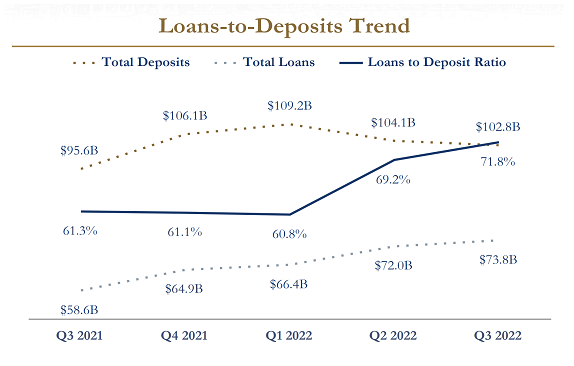
Loan-to-deposit ratio; source: Company Presentation
In addition, the bank is managing to offset a significant portion of the digital deposit outflow. For example, digital deposits declined by $3 billion in the last quarter, but total deposits were down only $1.3 billion, driven by an influx of new customers from other areas.
Unless bullish sentiment returns to the cryptocurrency markets, it is likely that Signature's digital deposits will eventually be displaced by more traditional sources of capital. Meanwhile, given the bank's high correlation to bitcoin, a new rally in the crypto market could see Signature stocks rise substantially. It's worth noting that Signet's customer base is steadily growing - the firm added 116 new clients in the last quarter, bringing its total to 1439. Coinbase, one of the largest crypto exchanges, announced in mid-October that it would use Signet to settle with its institutional customers.
Exemplary efficiency
Signature has seen steady and impressive growth over the years. Over the past 10 years, the bank's assets have grown by 554% and deposits by 629%. Signature has significantly expanded its geographical presence, grown its customer base and returned a solid amount of capital to its shareholders through dividend payments.
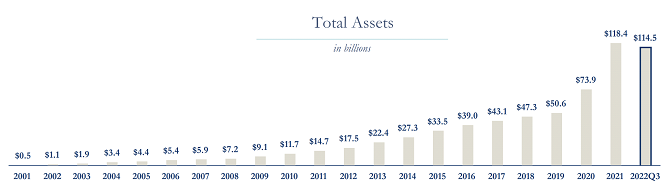
Bank asset performance; source: Company Presentation
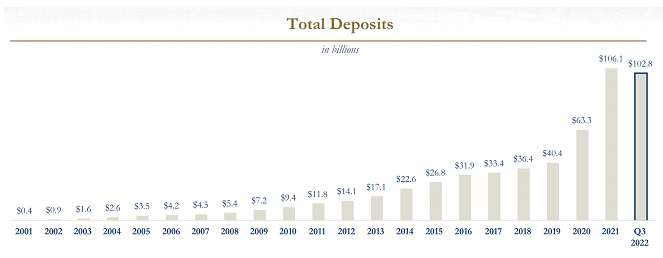
Bank deposit dynamics; source: Company Presentation
Management has been able to strike a balance between high growth and maintaining a conservative approach to lending. While crypto-market competitor Silvergate Capital has been aggressively lending against digital assets, shrinking its traditional loan portfolio, Signature has built a portfolio comprising 83% AAA-rated borrowers (AA - 11%, A - 3%, BBB - 3%). Notably, the bank's average annual net charge-off ratio since its inception in 2001 was 0.25%, compared with 0.91% for the top 50 US banks over the same period.
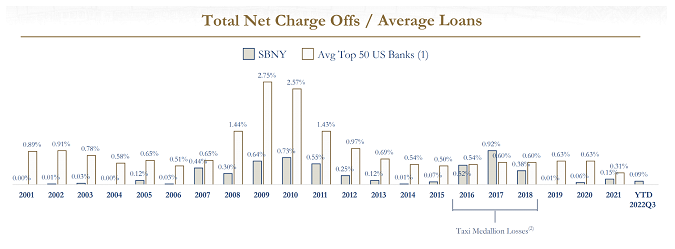
Volume of net write-offs; source: Company Presentation
Management has been able to strike a balance between high growth and maintaining a conservative approach to lending. While crypto-market competitor Silvergate Capital has been aggressively lending against digital assets, shrinking its traditional loan portfolio, Signature has built a portfolio comprising 83% AAA-rated borrowers (AA - 11%, A - 3%, BBB - 3%). Notably, the bank's average annual net charge-off ratio since its inception in 2001 was 0.25%, compared with 0.91% for the top 50 US banks over the same period.
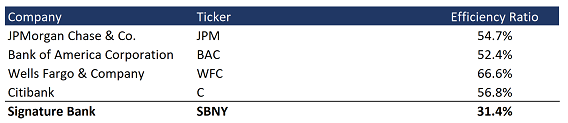
Comparison of the performance of Signature and the largest US banks; source: compiled by the author
Dividend yield
The bank currently pays out $0.56 per stock to shareholders on a quarterly basis, suggesting a dividend yield in the region of 1.9%. We expect the marginal payout to increase as headwinds from the digital deposit outflows are overcome, as:
- Signature has been paying dividends since the third quarter of 2018. The payout since then has been at a permanent level of $0.56 per stock per quarter (it is worth noting that the company maintained the payout even during the pandemic).
- Since then, diluted earnings per stock have risen by more than 120% and the payout ratio has consequently fallen from 24% to 11%.
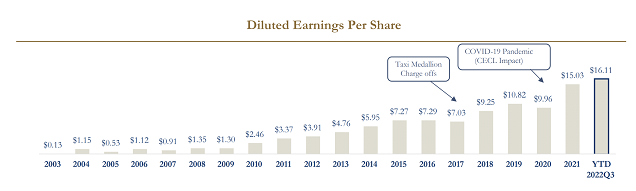
Diluted earnings per stock; source: Company Presentation
Dividend yield
The company's financial results for the last 12 months can be summarised as follows
- Interest income in the last 12 months (TTM) was $2.99 billion, an increase of 36.9% year-on-year. The increase was due to a tightening of monetary policy and an increase in interest rates.
- Non-interest income rose 23.5% over the same period to $149 million.
- Profit before tax reached $1.73 billion, up 38.3% on the year. The margin on this measure was 54.82%, compared with 53.99% for the year.
- Net profit rose 43.6% to $1.31 billion. Net margin increased by 1.8 percentage points to 41.55%.
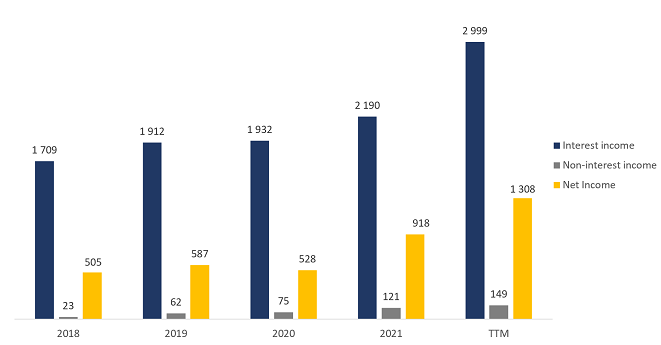
Company financial results; source: compiled by the author
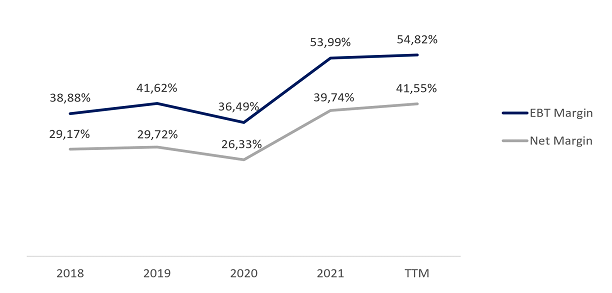
Company margin dynamics; source: compiled by the author
The financial results for Q3 2022 are shown below:
- Interest income was $977 million, an increase of 75.7% over the comparable period last year.
- Non-interest income rose 39.5% year on year to $43.8 million.
- Profit before tax was $463 million, up 41.7% year-on-year. The margin on this measure was 45.4% compared to 55.7% for the year.
- Net income increased by 48.5% to $359 million. Net margin decreased from 41.12% to 35.13%. The decline is due to a reduction in net interest income margin from 85.8% to 66.1%, due to higher sensitivity of the balance sheet liability to an increase in the key rate.
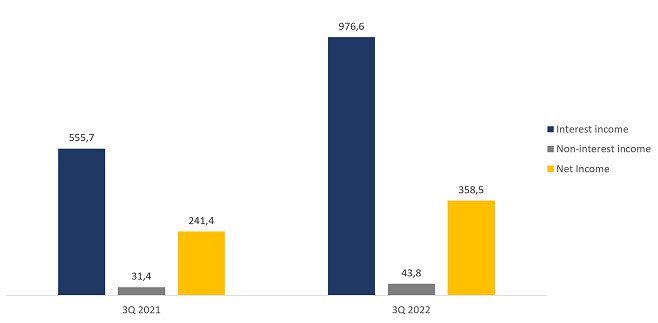
Company financial results; source: compiled by the author
High margins have enabled Signature to achieve record return on assets (ROA) and return on equity (ROE). Over the past 12 months, ROA has risen from 0.95% to 1.18% and ROE has reached an impressive 17.02%.
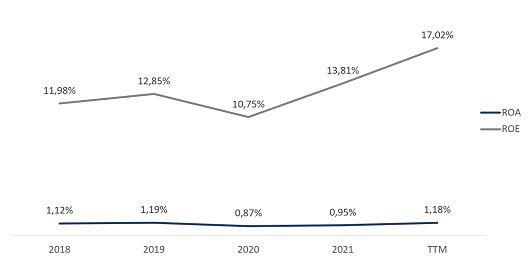
Signature's profitability figures; source: compiled by the author
As around 50% of company loans are at floating rates, we expect interest income to continue to rise as interest rates in the economy rise. However, margins could come under pressure as the balance sheet liability is more sensitive to monetary policy tightening. However, management expects margins and ROE to remain around current levels.
At the end of Q3 2022, the company's TTM operating cash flow (Cash from Operations) amounted to $1.29 billion against $880 million for the year. Free cash flow for the same period rose from $847 million to $1.24 billion.
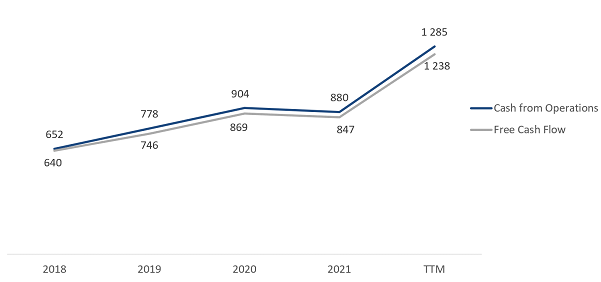
Company cash flow; source: compiled by the author
The Federal Deposit Insurance Corporation (FDIC) classifies Signature as a Well Capitalied bank. The Total capital to risk-weighted assets ratio is 11.99%, with a standard ratio of 10.00%. Tier 1 capital accounts for 10.90% of the minimum requirement of 8.00%. The Common stock tier 1 capital ratio is 10.11% with a requirement of 6.50%. Tier 1 leverage capital corresponds to 8.47% with a standard requirement of 5.00%.
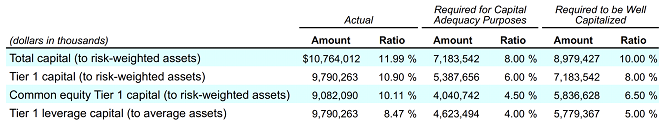
Bank financial soundness; source: 10-Q Filing
Evaluation
Despite having one of the highest ROEs, Signature trades at a discount to the industry average: P/Cash flow is 5.80x, P/E is 5.79x, FWD P/E is 5.98x. Typically, banks with double-digit ROEs trade at a premium to book value, but Signature has a P/B multiple of 0.97x.
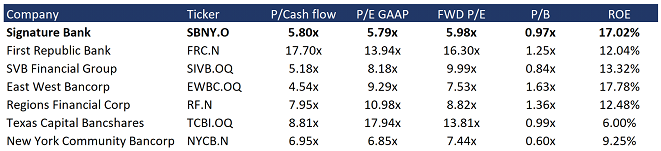
Comparable estimate; source: compiled by the author
The minimum price target from investment banks, set by Stephens, is $150 per stock. In turn, Wells Fargo values SBNY at $250. By consensus, the fair market value of the stock is $196, which implies a 68% upside potential.
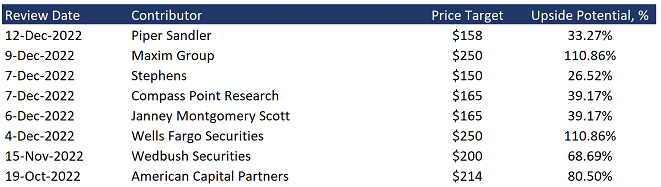
Price targets of investment banks; source: compiled by the author
Key risks
- Throughout its history, Signature has regularly raised additional capital through stock sales. There is a possibility that the company will continue to dilute capital as additional funding is needed. It is worth noting that despite the increase in the number of stocks, return on stock and earnings per stock have shown steady growth.
- We have noted that digital deposits may be displaced by more traditional sources of capital. However, the cost of capital raised may rise because digital deposits are interest-free.
- There are certain operational, financial and regulatory risks associated with operating in the digital asset market.
- The rising cost of money, driven by higher interest rates in the economy, could lead to difficulties in continuing to increase the loan portfolio and slow down Signature's growth.
Sources of information
- https://www.tradingview.com/chart/oa4oXcQM/?symbol=NASDAQ%3ASBNY
- https://s1.q4cdn.com/665033567/files/doc_financials/2022/q3/Earnings-Deck-Slides-Q3-2022.pdf
- https://www.businesswire.com/news/home/20221012005945/en/Coinbase-Commences-Partnership-With-Signature-Bank-to-Provide-Real-Time-Settlement-via-Signet%E2%84%A2
- https://www.bankregdata.com//allIEmet.asp?met=EFF
- https://investor.signatureny.com/financials/regulatory-fillings/default.aspx
- https://s1.q4cdn.com/665033567/files/doc_downloads/sec/57345719.pdf
- https://s1.q4cdn.com/665033567/files/doc_downloads/2022/03/SignatureBank-12.31.21-10K-FINALv2.pdf
- https://s1.q4cdn.com/665033567/files/doc_downloads/insider-filings/2022/11/3Q-2022-10Q-FINAL.pdf
- https://s1.q4cdn.com/665033567/files/doc_financials/2021/q3/3Q-2021-10Q-FINAL.pdf
- https://seekingalpha.com/article/4547265-signature-bank-sbny-q3-2022-earnings-call-transcript
-
Refinitiv
Recommendation Evaluation Methodology
Lion Capital Group analysts perform a three-stage analysis. They select a promising industry based on the latest news, statistics and industry-specific metrics. They assess the supply and demand situation and its future development dynamics. Industry’s investment attractiveness is mostly affected by the forecasted market growth rates; total addressable market, player concentration level and likeliness of a monopoly formation, as well as the level of regulation by various entities or associations.
The assessment is followed by the comparative analysis based on the selected sample. The sample comprises companies with a market capitalization of over USD 1 billion, but there is space for exceptions (when the suitable level of liquidity for company’s securities is available on the stock exchange). The selected companies (peers) are being compared against each other based on multipliers (EV/S, EV/EBITDA, PE, P/FCF, P/B), revenue growth rates, marginality and profitability (operating income margin, net income margin, ROE, ROA), and business performance.
Having completed the comparative analysis, the analysts carry out a more in-depth research of the news about the selected company. They review company’s development policy, information about its current and potential mergers and acquisitions (M&A activity), and assess the efficiency of company's inorganic growth and other news about it over the past year. The main objective at this stage is to identify the growth drivers and evaluate their stability, as well as the extent of impact they have on the business.
Based on all the data collected, the analysts determine the weighted forecasted figures of company’s growth rates and proposed business marginality, which are used to calculate the company’s multiplier-based estimated value. The said value enables setting the stock price target and stock value growth potential.
The expected timing of the idea implementation is set depending on the current market situation, volatility level and available forecasting horizon for industry and company development. The forecasting period is normally set between 3 and 12 months.
Disclaimer
Information and analytical services and materials are provided by Lion Capital Group as part of the services specified and are not an independent activity. The Company reserves the right to refuse service to persons not meeting the criteria for clients, or those subject to bans / restrictions on such services in accordance with the European Union laws. Restrictions may also be imposed by the internal procedures and controls of Lion Capital Group. Lion Capital Group provides financial services in the European Union in accordance with license CIF 275/15 for all types of activities required by the company as granted by the Cyprus Securities and Exchange Commission (CySEC) on 20.05.2015. Disclaimer: Additional information is available upon request. Investing in securities and other financial instruments always involves the risk of capital loss. The client must personally acknowledge this, including by reading the Risk Disclosure Notice. Opinions and estimates represent our judgments as of the date hereof and are subject to change without notice. Fees, charges and other expenses may reduce the financial performance of your investment. Past returns do not guarantee future returns. This material is not intended to be an offer or solicitation to buy or sell any financial instrument. The opinions and recommendations provided herein do not consider any individual circumstances, goals or needs of the client and do not constitute an investment advisory service. Recipients of this report must make their own independent decisions in relation to any securities or financial instruments referred to herein. The information has been obtained from sources that Lion Capital Group believes to be reliable; its affiliates and/or subsidiaries (jointly referred to as Lion Capital Group) do not guarantee completeness or accuracy of such information, save for disclosures related to Lion Capital Group and/or its affiliates/agents and analyst's interactions with the issuer being the subject of research. All prices provided are indicative closing prices for the securities in question, unless otherwise specified.
Terms and conditions of market research use
Company income statement
| 2023 | |
|---|---|
| Revenue | 2 001.42M |
| EBITDA | 1 578.64M |
| Net Income | 918.44M |
| Net Income Ratio | 45.89% |
Financial strength
| 2023 | |
|---|---|
| Debt/Eq | 1410.66% |
| FCF Per Share | 16.10 |
| EPS | 17.45 |
| Payout ratio | 18.31% |
Management efficiency
| 2023 | |
|---|---|
| ROAA | 0.78% |
| ROAE | 11.71% |
| ROI | 0.00% |
| Asset turnover | 0.02 |
| Receivables turnover | 6.52 |
Margin
| 2023 | |
|---|---|
| Gross Profit Margin | 0.00% |
| Net Profit Margin | 45.89% |
| Operating Profit Margin | 0.00% |