Why do we like SPORTRADAR GROUP AG?
Reason 1. Industry potential
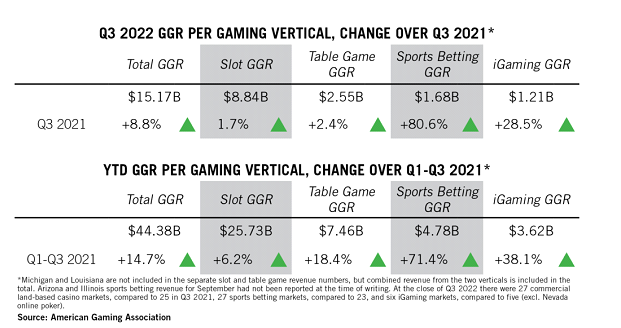
As Sportradar's main platform users are sports federations, media and betting companies, interest in sports events and the growth of sports-related markets will be key to the company's growth. According to Mordor Intelligence, the global online betting market expects to grow at a compound annual growth rate (CAGR) of 10.23% until 2027. That said, as we covered in our investment story on MGM Resorts , the sports betting segment is the fastest-growing area of the gaming industry in the US. According to American Gaming Association research, at the end of Q3, GGR (gross gaming revenue - the difference between the amount players bet and the amount they win) in this segment grew by 80.6% year-on-year and by 71.4% YTD.
According to analysts at Goldman Sachs , the online sports betting market could reach $39bn by 2033, showing an average annual growth rate of 37% over the 2021-2033 horizon.
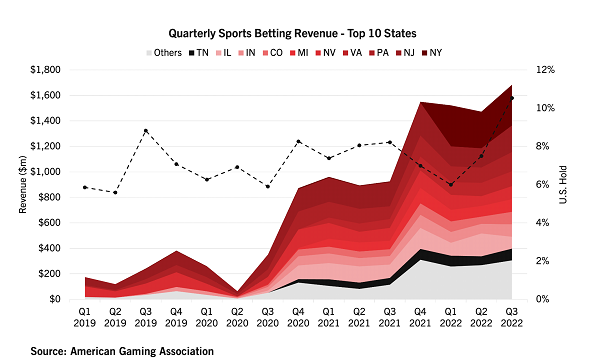
The share of revenue from the sports betting industry in relation to the entire gaming sector has surpassed the 10% mark. The graph below shows that this share is increasing rapidly.
In our view, there is reason to expect continued rapid growth in this area, with Sportradar's financial performance and stock price improving along with it.
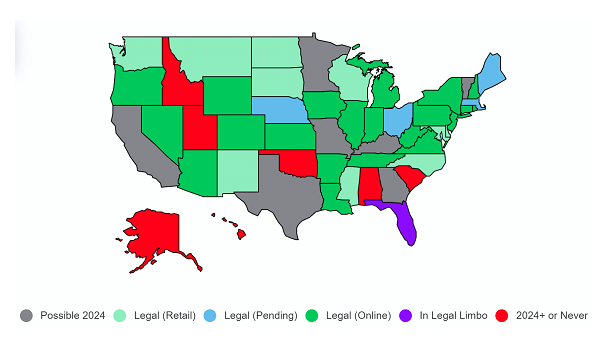
Further legalisation of sports betting in selected US states could prove to be an additional growth driver for the industry. The good news for the company is the legalisation of this activity from the beginning of 2023 in the state of Ohio. FanDuel, with whom Sportradar renewed its contract at the end of October to supply NBA data and additional betting services until 2031, will be introduced there. In addition, Sportradar announced on 1 December that it had obtained a sports gambling supplier's licence in Ohio, preparing for the legalisation of gaming in that state and increasing the company's total number of licences to 41.
There is potential for an expansion of the legalisation of sports betting in the country. For instance, the following states are currently in the process of legalisation:
- Maine and Nebraska - approved, pending further regulatory action
- Massachusetts-approved, pending launch
- California - attempts are being made
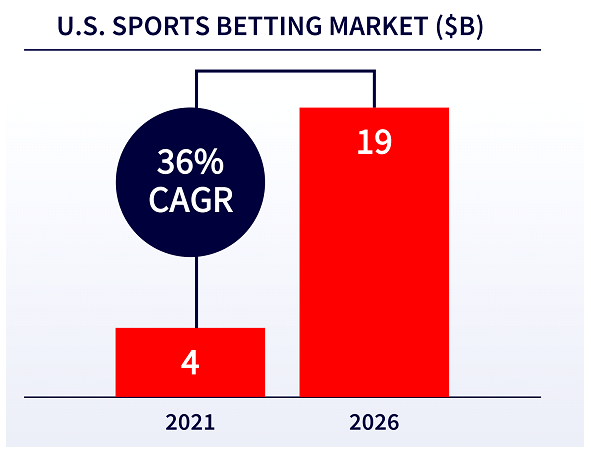
Sportradar itself, citing data from Vixio Gambling Compliance, predicts growth in the US sports betting market with a CAGR of 36% over the 2021-2026 horizon.
The share of revenue Sportradar receives from the US is a small proportion of the company's total revenue, but has risen year on year from 14.6% to 17.8%.
Online sports betting has enormous growth potential. Sportradar currently has a small market share in the US, but plans to grow aggressively. If successful, the company could grow its revenue substantially in the near term, which would have a positive effect on its value.
Reason 2. Increase in financial performance and key metrics across the board
Sportradar identifies several main areas of business:
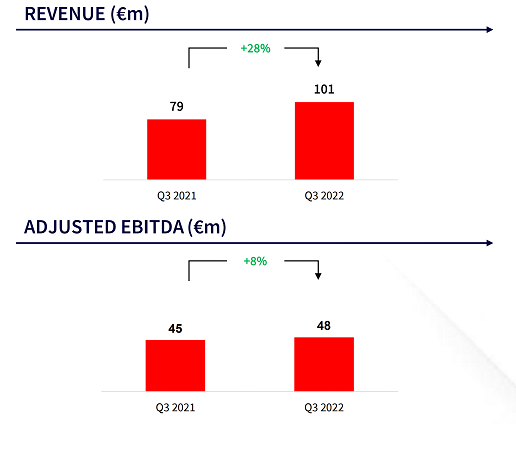
- RoW Betting: a segment in which the company offers bookmakers a range of services from business and management solutions to data, streaming and marketing services. The RoW Betting segment posted revenue growth of 28% to €101m and adj. EBITDA by 8% to €48 million, driven by improvements in managed betting services (+84% year-on-year) and Live Odds (+12% year-on-year). Margins adj. EBITDA margin declined from 57% to 48% year-on-year due to temporary savings on sports rights and scouting costs as well as investments in artificial intelligence capabilities.
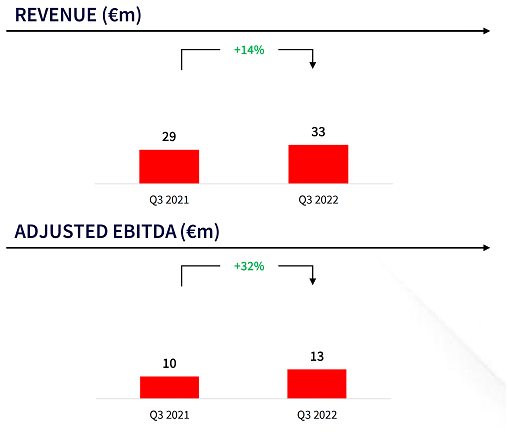
- RoW Audiovisual: a segment offering audiovisual sports content. This segment posted a 14% increase in revenue to €33 million and an increase in EBITDA of 32% to €13 million. EBITDA by 32% to €13 million, driven by cross-selling of audiovisual content to previously data-only customers and increased sales of additional content. The margin for adj. EBITDA margin increased from 33% to 38%.
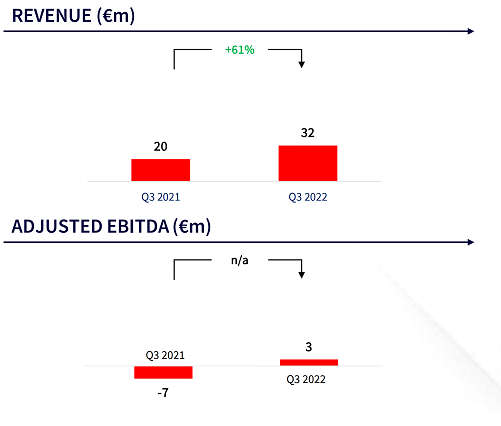
- United States: the segment services for bookmakers as well as the provision of audio-visual content and advertising in the US. The business increased revenue by 61% to €32 million and adj. EBITDA from €7 million to €3 million, driven by a 144% year-on-year increase in revenue generated in the US from betting, 110% from advertising and 87% from audio-visual content. Margin adj. EBITDA at the same time rose from -34% to 11%. It can be concluded that management sees great growth potential in the US market and is increasing its presence.
Financial indicators
The company's results for the last 12 months:
TTM revenue: up from €485.4m to €676.3m
TTM's operating profit: up from €25.3 million to €32.4 million:
in terms of operating margins - decrease from 5.2% to 4.8% due to an increase in SG&A expenses from 31.1% to 34.3%
TTM net profit: up from €12.4 million to €47.6 million:
in terms of net margin, up from 2.6% to 7%, mainly due to the absence of interest expense for the period
Operating cash flow: up from €143 million to €154.9 million
Adjusted free cash flow: up from €44.2 million to €60 million
Based on the results of the most recent reporting period:
Revenue: up from €136.8m to €178.8m
Operating profit: up from €6.2 million to €14.1 million:
in terms of operating margins, an increase from 4.5% to 7.9% due to a decrease in the cost of revenue from 21.5% to 26.6%
Net profit: up from €8.8 million to €12.5 million:
in terms of net margin, up from -6.4% to 7%
Operating cash flow: up from €58.1m to €63.8m
Adjusted free cash flow: up from €32.9m to €33.9m
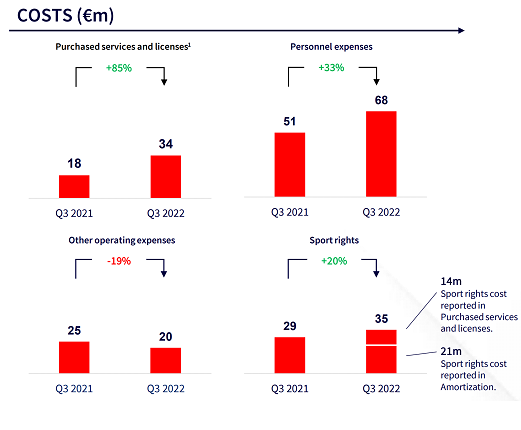
Sportradar has shown good financial performance in the last 12 months as well as in the last quarter. At the same time, the company's spending is more of an investment - the biggest increase in spending is seen in the acquisition of services and operating licences (top left-hand graph).
- Cash and cash equivalents: €512.5 million
- Net debt: €269 million
Sportradar has negative net debt and a good cash reserve on its balance sheet, which demonstrates its financial strength. In addition to cash on the balance sheet, the company also has an undrawn line of credit, expanding its available liquidity to €732.5 million, which gives it a good opportunity to invest in M&A deals to expand its business.
Evaluation
Due to the specific nature of Sportradar's business, we have also added companies in the gaming and entertainment sports content business to the benchmarking sample. When compared to such a group, the company is undervalued by EV/EBITDA and P/B and overvalued by EV/S (3.97x vs. 3.23x), P/CF (15.55x vs. 12.45x) and P/E (66.59x vs. 27.75x).
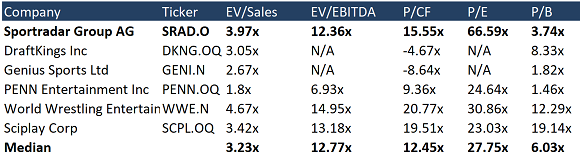
Source: Refinitiv
The high marks are due to the rapid pace of improvement in financial performance: as the chart below shows, TTM's net profit for the latest quarter is several times higher than for the full year 2021.
Source: Refinitiv
For 2022, Sportradar's management expects revenue in the range of €718-€723m and adjusted EBITDA margins in the range of 17%-18%. We believe the forecast is realistic and do not expect significant upward or downward variations.
Ratings of other investment houses
The minimum price target set by Bank of America is $8 per stock. Craig Hallum has in turn set a target price of $25. According to the consensus target price target from the beginning of summer, the fair value of Sportradar stock is $15.33 per stock, which implies a 47.78% upside potential.
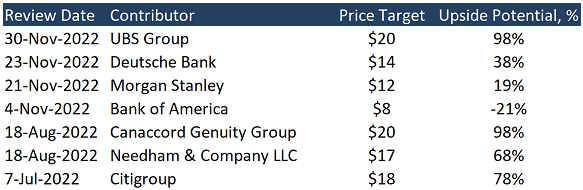
Source: Marketbeat
Key risks
- The legalisation of rates in individual states could be delayed, reducing the growth rate of the company's financial performance.
- Cyberattacks in the US are on the rise - data loss could be sensitive for the company.
- A deteriorating macroeconomic environment may contribute to an exodus of customers.
Sources of information
- https://www.mordorintelligence.com/industry-reports/online-sports-betting-market
- https://www.bloomberg.com/graphics/2021-opinion-online-sports-betting-future-of-american-gambling/
- https://freedom24.com/ideas/details/13264
- https://www.americangaming.org/new/q3-2022-sets-second-consecutive-record-for-quarterly-commercial-gaming-revenue/
- https://www.americangaming.org/resources/aga-commercial-gaming-revenue-tracker/
- https://investors.sportradar.com/news-releases/news-release-details/sportradar-awarded-ohio-sports-gaming-supplier-license
- https://www.forbes.com/betting/sports-betting/california/
- https://www.actionnetwork.com/news/legal-sports-betting-united-states-projections
- https://investors.sportradar.com/static-files/422dc3f6-3935-4f3c-99e1-ac8978d22403
- https://investors.sportradar.com/news-releases/news-release-details/sportradar-and-baseball-australia-take-australian-baseball
- https://investors.sportradar.com/news-releases/news-release-details/sportradar-launches-first-its-kind-virtual-stadium-solution
Recommendation Evaluation Methodology
Lion Capital Group analysts perform a three-stage analysis. They select a promising industry based on the latest news, statistics and industry-specific metrics. They assess the supply and demand situation and its future development dynamics. Industry’s investment attractiveness is mostly affected by the forecasted market growth rates; total addressable market, player concentration level and likeliness of a monopoly formation, as well as the level of regulation by various entities or associations.
The assessment is followed by the comparative analysis based on the selected sample. The sample comprises companies with a market capitalization of over USD 1 billion, but there is space for exceptions (when the suitable level of liquidity for company’s securities is available on the stock exchange). The selected companies (peers) are being compared against each other based on multipliers (EV/S, EV/EBITDA, PE, P/FCF, P/B), revenue growth rates, marginality and profitability (operating income margin, net income margin, ROE, ROA), and business performance.
Having completed the comparative analysis, the analysts carry out a more in-depth research of the news about the selected company. They review company’s development policy, information about its current and potential mergers and acquisitions (M&A activity), and assess the efficiency of company's inorganic growth and other news about it over the past year. The main objective at this stage is to identify the growth drivers and evaluate their stability, as well as the extent of impact they have on the business.
Based on all the data collected, the analysts determine the weighted forecasted figures of company’s growth rates and proposed business marginality, which are used to calculate the company’s multiplier-based estimated value. The said value enables setting the stock price target and stock value growth potential.
The expected timing of the idea implementation is set depending on the current market situation, volatility level and available forecasting horizon for industry and company development. The forecasting period is normally set between 3 and 12 months.
Disclaimer
Information and analytical services and materials are provided by Lion Capital Group as part of the services specified and are not an independent activity. The Company reserves the right to refuse service to persons not meeting the criteria for clients, or those subject to bans / restrictions on such services in accordance with the European Union laws. Restrictions may also be imposed by the internal procedures and controls of Lion Capital Group. Lion Capital Group provides financial services in the European Union in accordance with license CIF 275/15 for all types of activities required by the company as granted by the Cyprus Securities and Exchange Commission (CySEC) on 20.05.2015. Disclaimer: Additional information is available upon request. Investing in securities and other financial instruments always involves the risk of capital loss. The client must personally acknowledge this, including by reading the Risk Disclosure Notice. Opinions and estimates represent our judgments as of the date hereof and are subject to change without notice. Fees, charges and other expenses may reduce the financial performance of your investment. Past returns do not guarantee future returns. This material is not intended to be an offer or solicitation to buy or sell any financial instrument. The opinions and recommendations provided herein do not consider any individual circumstances, goals or needs of the client and do not constitute an investment advisory service. Recipients of this report must make their own independent decisions in relation to any securities or financial instruments referred to herein. The information has been obtained from sources that Lion Capital Group believes to be reliable; its affiliates and/or subsidiaries (jointly referred to as Lion Capital Group) do not guarantee completeness or accuracy of such information, save for disclosures related to Lion Capital Group and/or its affiliates/agents and analyst's interactions with the issuer being the subject of research. All prices provided are indicative closing prices for the securities in question, unless otherwise specified.
Terms and conditions of market research use
Company income statement
| 2023 | |
|---|---|
| Revenue | 561.20M |
| EBITDA | 185.31M |
| Net Income | 12.57M |
| Net Income Ratio | 2.24% |
Financial strength
| 2023 | |
|---|---|
| Debt/Eq | 140.15% |
| FCF Per Share | 0.00 |
| Interest Coverage | 1.64 |
| EPS | 0.01 |
| Payout ratio | 0.00% |
Management efficiency
| 2023 | |
|---|---|
| ROAA | 0.71% |
| ROAE | 1.70% |
| ROI | 3.50% |
| Asset turnover | 0.32 |
| Receivables turnover | 6.81 |
Margin
| 2023 | |
|---|---|
| Gross Profit Margin | 80.82% |
| Net Profit Margin | 2.24% |
| Operating Profit Margin | 9.46% |