Why do we like TELUS International?
Reason 1. Industry opportunity
Digital transformation is the main driver of all the company's target markets. According to Straits Research , the global digital transformation market was valued at $400.34 billion in 2021 and is expected to reach $2.20 trillion by 2030, implying a compound annual growth rate (CAGR) of 22.5%.
.png)
Expected market dynamics for digital transformation; source: compiled by the author
Technology integration into all corporate operations and functional areas provides significant growth potential for the Digital Customer Experience Management (DCEM) industry. The DCEM market is expected to grow at a compound annual growth rate of 18.1% through 2030, reaching $38.98 billion at the end of the forecast period.
.png)
Expected DCEM market dynamics; source: compiled by the author
Through the acquisitions of CCC and Lionbridge AI, TELUS has entered the large and promising markets of content moderation and data annotation for artificial intelligence (AI).
Due to the proliferation of misinformation on social media, there has been a steady increase in demand for content moderation. A telling example is a scandal surrounding Twitter over a possible moderation policy change. Typically, companies like Twitter and Facebook do not moderate content themselves but rather outsource this task to firms like TELUS. Allied Market Research estimates that this market will grow at a compound annual growth rate of 12.2% until 2031, when it reaches $26.3 billion.
AI development depends on the quality of the data on which machine learning is based. For data to be valuable, it must be tagged (annotated) by humans. TELUS is one of the leaders in this market. The data annotation market for AI is expected to grow at a compound annual growth rate of 26.6% to reach $5.3 billion by 2030.
Reason 2. Strong competitive positioning
TELUS provides three categories of services: solution design (Design), implementation (Build) and delivery (Deliver). If a company is experiencing problems with the customer experience, TELUS can identify the source of the issues and develop a solution. Once the problem has been identified, the client can then engage TELUS to implement the earlier proposed solution (e.g. launch a website). TELUS can then provide support for the implemented solution (e.g. maintain the website).
Thus, unlike most industry players, the company can provide its clients with comprehensive solutions that consider their needs at all stages and allow TELUS to consider changing trends as the firm evolves. The ability to provide complex solutions makes the company attractive to large enterprises that prefer to deal with a single supplier capable of offering a "package deal" and ensuring business continuity. As such, TELUS has a significant advantage over its competitors.
Reason 3. Exemplary M&A deals
What sets TELUS apart is its enviable track record in mergers and acquisitions. The company was born by acquiring a small call centre in the Philippines with 1,500 employees, but it has grown into an industry giant with more than 70,000 employees through effective acquisitions. Through M&A deals, TELUS has entered the IT consulting, computer vision technology, data annotation for lidar systems, and the aforementioned markets of content moderation and data annotation for AI.
.png)
TELUS development history; Source: Company's Annual Report
During the Q3 2022 earnings conference call, management noted that thoughtful M&A deals would remain a key part of the company's long-term growth model. A year earlier, CFO Vanessa Kanu emphasised that future acquisitions would increase revenues and improve margins. We expect future M&A deals to be largely complementary rather than transformational. We could see new deals already in the short to medium term, as the company has a relatively low debt burden, a positive liquid asset balance sheet and growing cash flow (see below for details).
Given TELUS' deep expertise in the M&A market, we believe it is prudent to view the extensional development model as an advantage for the company and a potential driver for sustainable growth in the long term.
Financial indicators
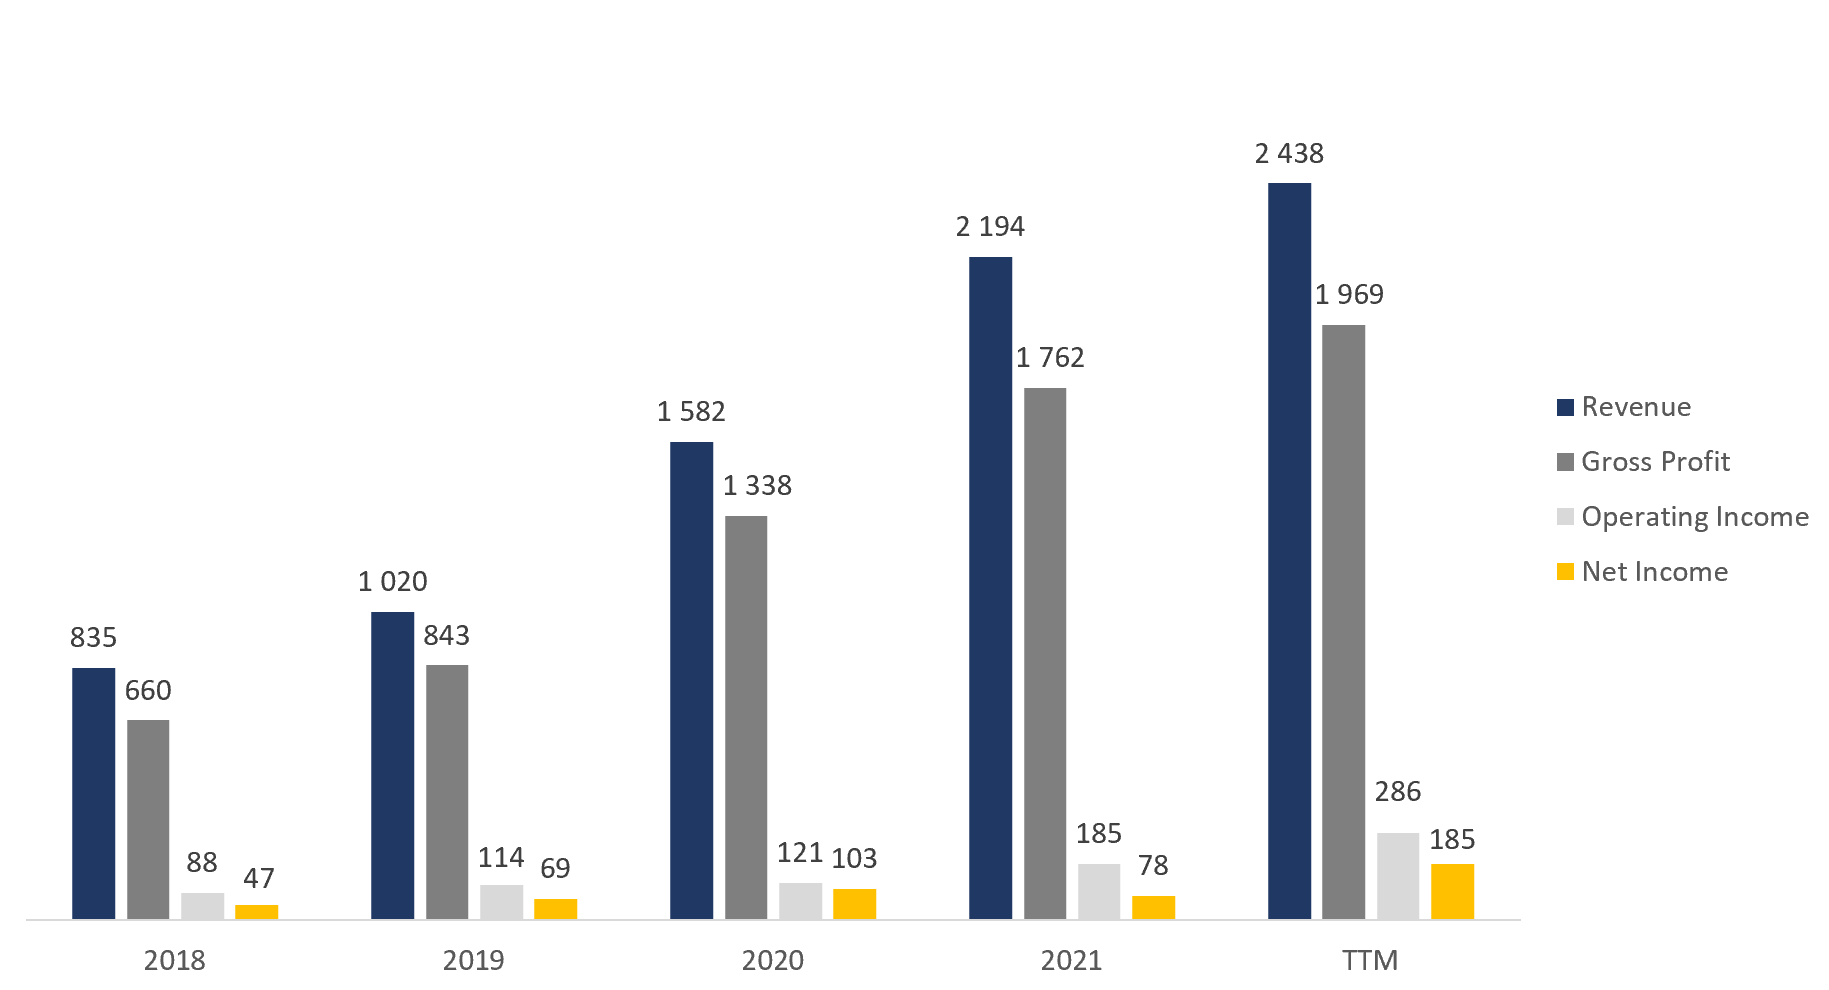
The company's results for the past 12 months can be summarised as follows
- TTM's revenue was $2.44 billion, up 11.1% from 2021.
- Gross profit increased from $1.76 billion to $1.97 billion. Gross margin increased from 80.31% to 80.76%.
- Operating profit increased from $185 million to $286 million. The operating margin was 11.73% compared to 8.43% for the year.
- Net profit was $185 million compared to $78 million for the year. Net profit margin increased from 3.56% to 7.59%.
Company margin dynamics; source: compiled by the author
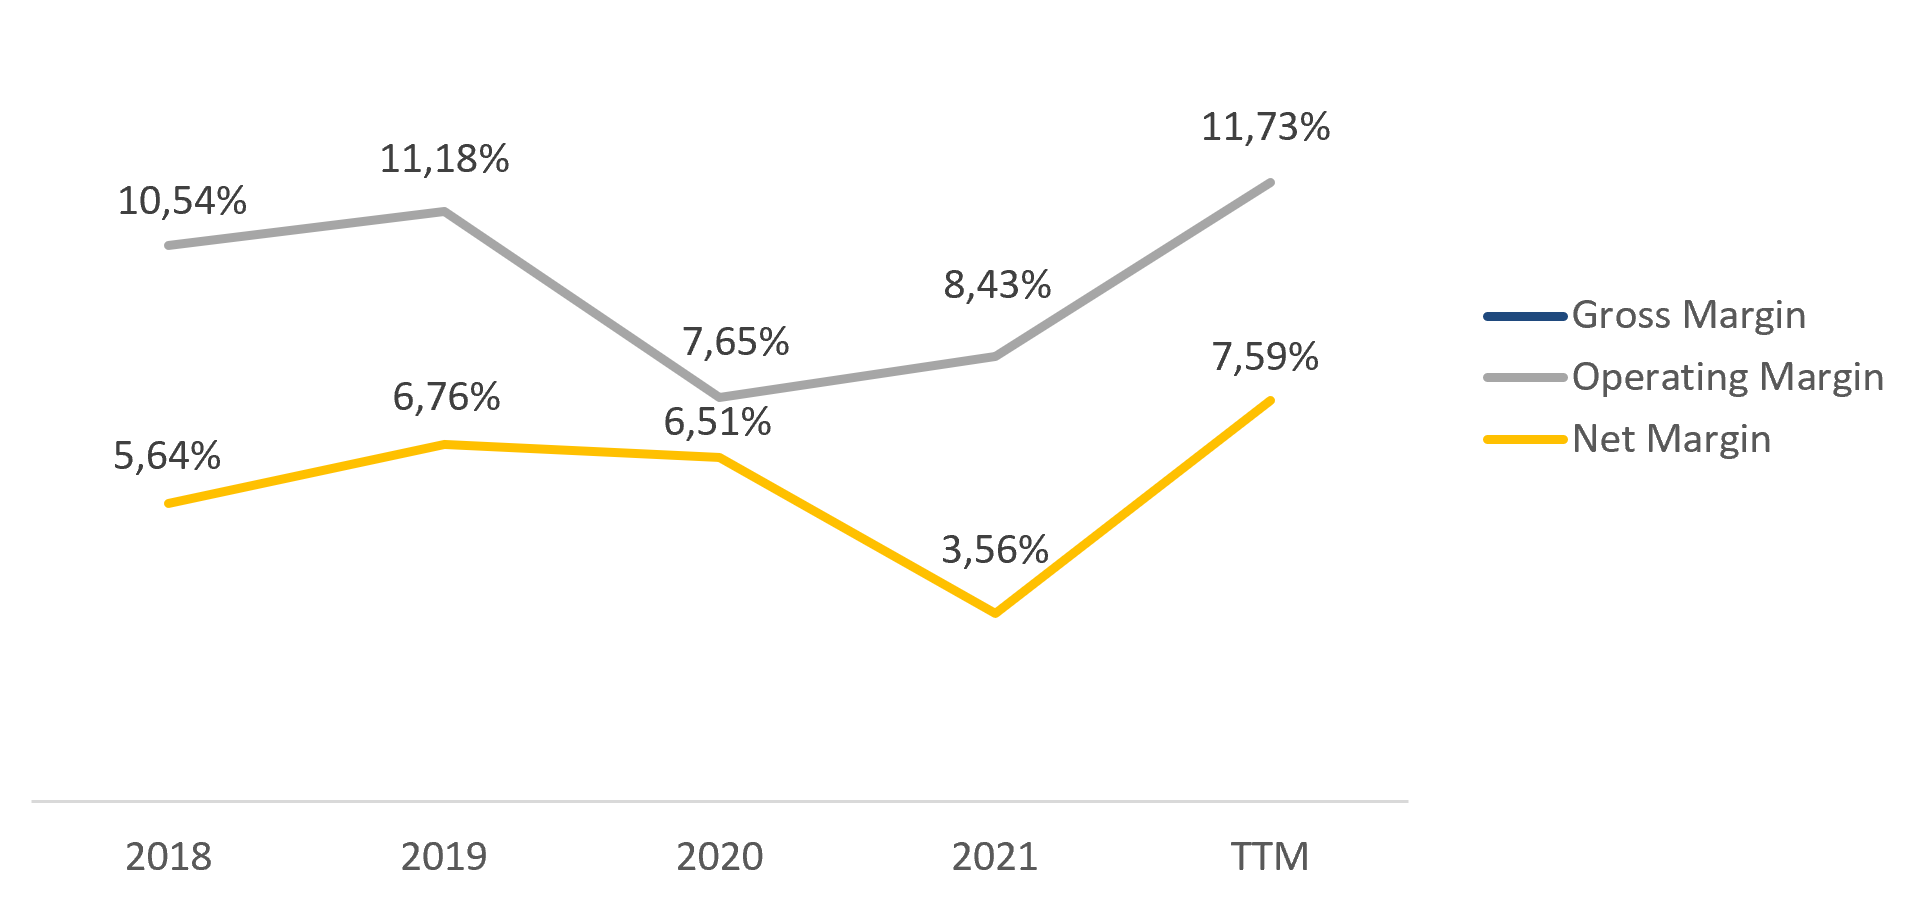
Company margin dynamics; source: compiled by the author
TELUS, like any IT services company, is a labour-intensive business. Employee salaries and bonuses account for more than half of the company's expenses, limiting operating leverage growth. Without acquisitions of firms capable of delivering synergies or with higher margins, TELUS' margins are likely to remain in the high single/low double digits.
The financial results for the 33rd quarter of 2022 are as follows
- Revenue rose 10.6% year on year, from $556 million to $615 million.
- Gross profit increased by 13.0% year-on-year: from $446 million to $504 million. Gross margin increased by 1.7 percentage points: from 80.22% to 81.95%.
- Operating profit was $84 million compared to $47 million a year earlier. The operating margin increased from 8.45% to 13.66%.
- Net profit was $59 million compared to $23 million a year earlier. Net margin increased from 4.14% to 9.59%.
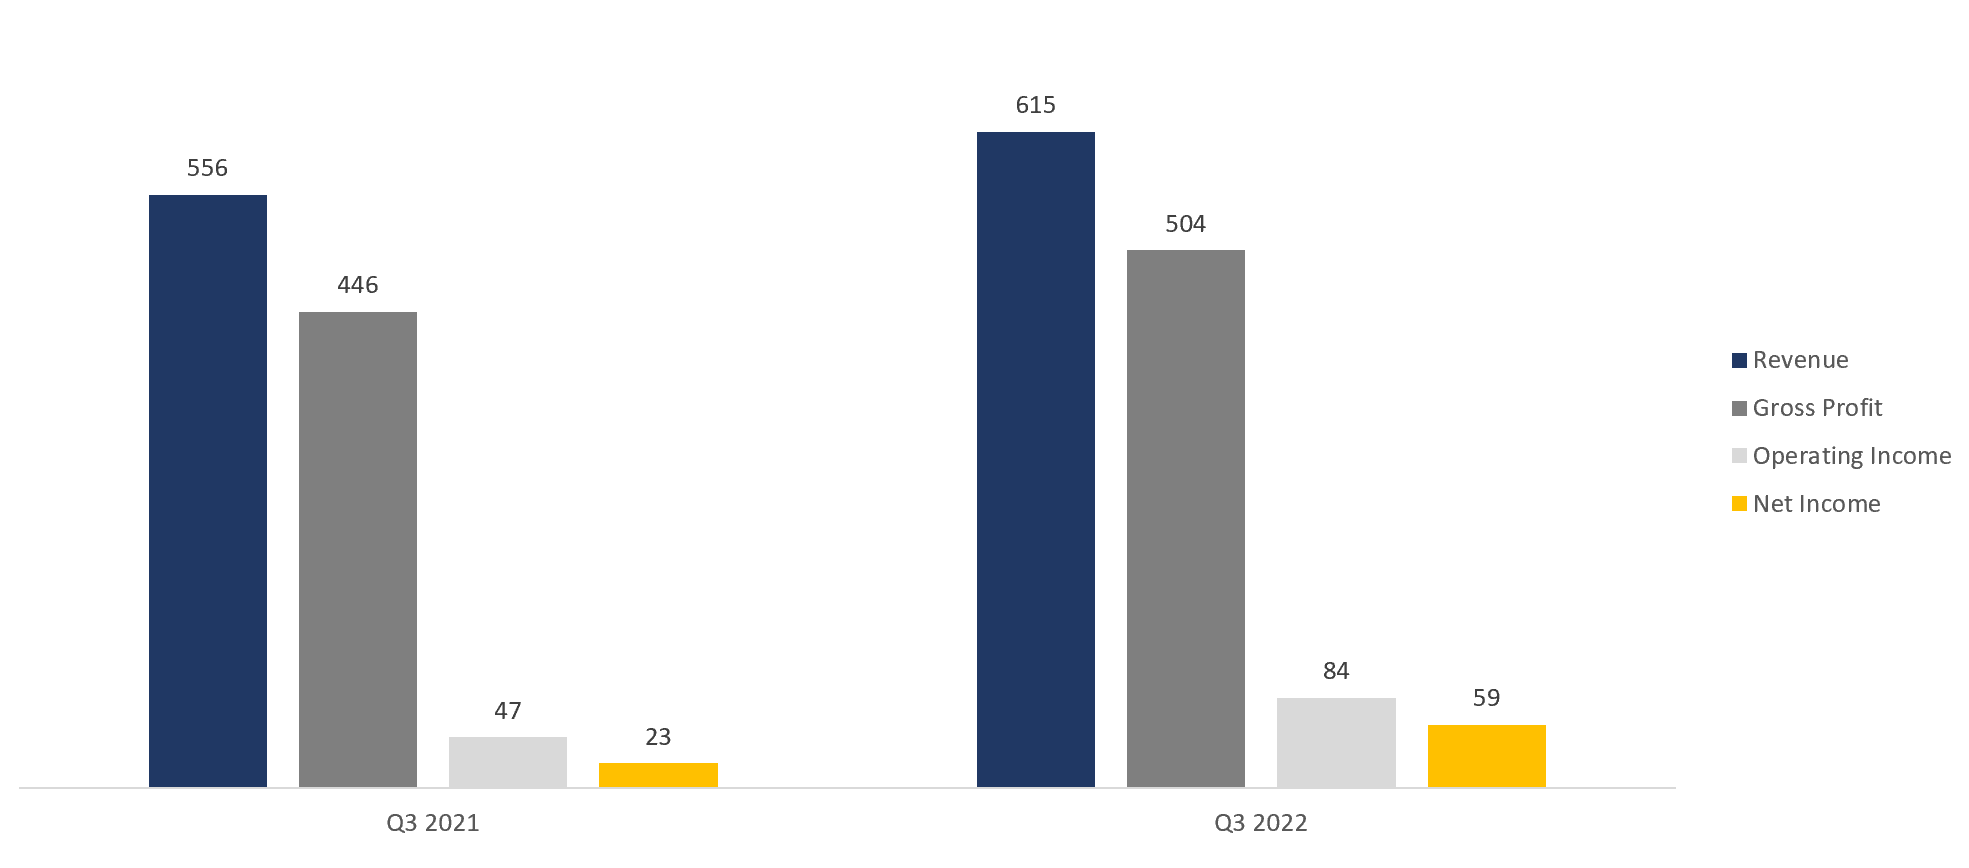
Trends in the company's financial results; source: compiled by the author
TTM operating cash flow stood at $401 million for the latest reporting period, compared to $282 million for the entire year. Free cash flow to equity increased from $181 million to $293 million. The increase was driven by higher net income.
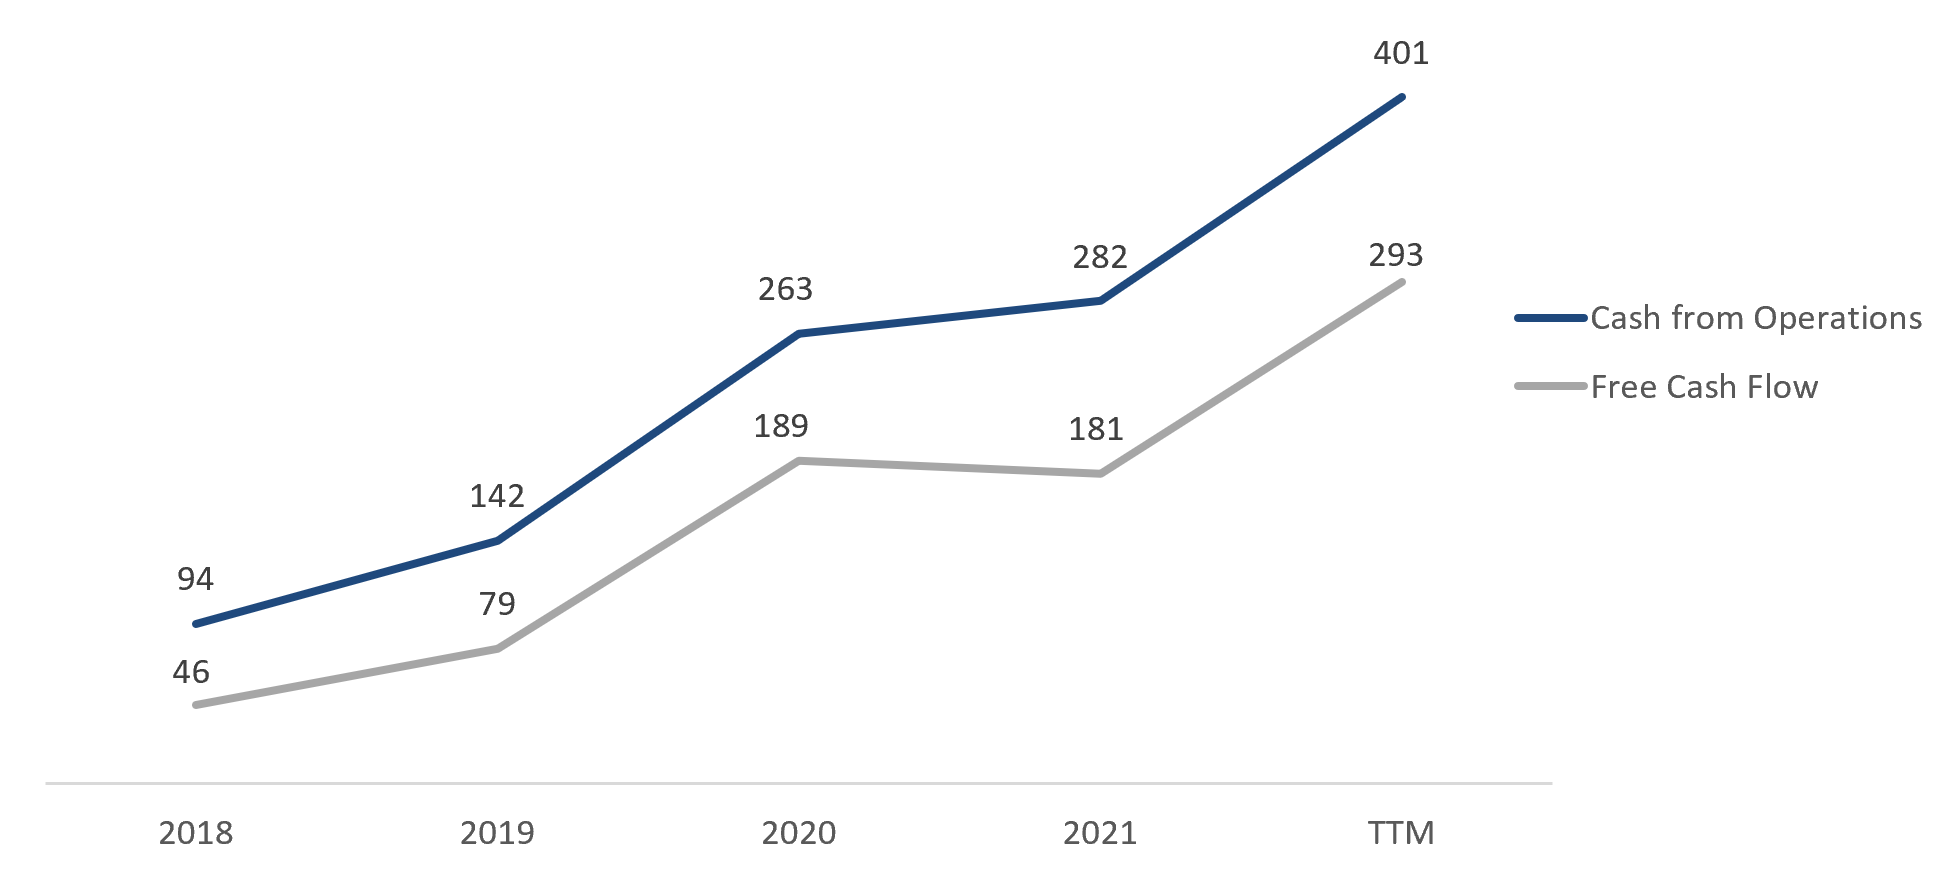
Company cash flow; source: compiled by the author
TELUS has a strong balance sheet: total debt is $986 million, cash equivalents and short-term investments account for $143 million, and net debt is $843 million, which is 1.5 times TTM EBITDA (Net debt/EBITDA — 1.49x).
Evaluation
TELUS trades at a discount to the industry average: EV/Sales — 0.92x, EV/EBITDA — 4.00x, P/Cash flow — 3.52x, P/E — 30.90x, FWD P/E — 15.16x, P/B — 2.68x.
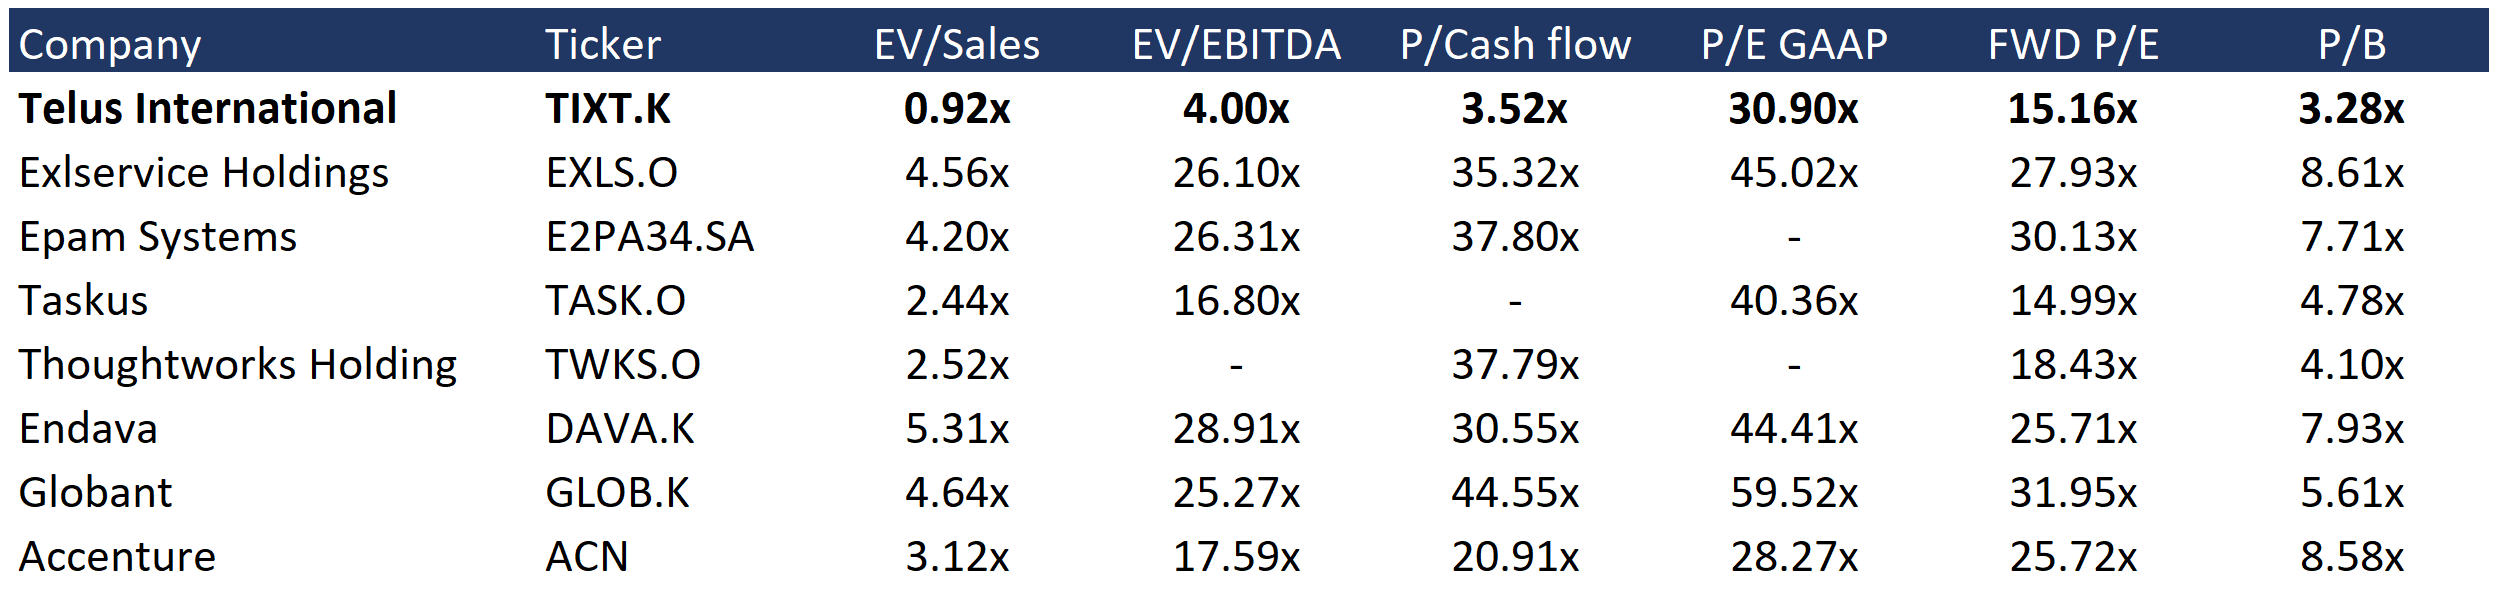
Comparable estimate; source: compiled by the author
The minimum price target from investment banks set by Scotiabank is $26 per share. CIBC Capital, on the other hand, values TIXT at $36.5 per share. By consensus, the fair market value of the stock is $30 apiece, suggesting a 41.3% upside potential.
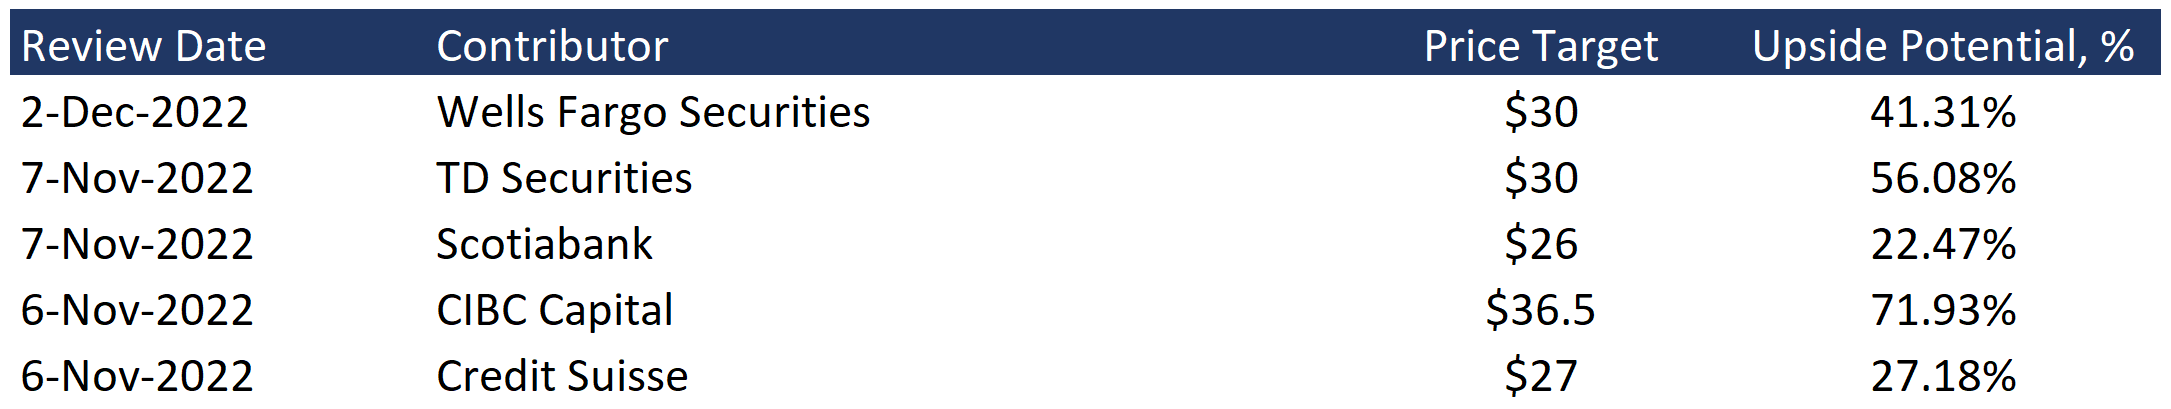
Price targets of investment banks; source: compiled by the author
Key risks
- TELUS is characterised by a high concentration of revenues — the 10 largest customers account for around 60% of revenues. The loss of one of these customers could significantly impact the company's financial performance.
- A deteriorating macroeconomic environment could reduce spending on digital transformation, which is likely to affect demand for TELUS services and lead to a deterioration in the company's financial performance.
- A significant concentration on mergers and acquisitions creates risks to shareholder value. There is a possibility that TELUS will overpay for a particular business or that the fundamental qualities of the acquired companies will prove to be worse than initially estimated.
Sources of information
- https://www.globenewswire.com/en/news-release/2022/08/25/2504937/0/en/Digital-Transformation-Market-Size-is-projected-to-reach-USD-2-1-Trillion-by-2030-growing-at-a-CAGR-of-23-72-Straits-Research.html
- https://www.grandviewresearch.com/press-release/global-customer-experience-management-cem-market
- https://www.businesswire.com/news/home/20200204005273/en/TELUS-Corporation-Completes-Acquisition-of-Competence-Call-Center-Through-TELUS-International
- https://www.businesswire.com/news/home/20210302005381/en/TELUS-International-completes-acquisition-of-Lionbridge-AI
- https://www.reuters.com/technology/eu-warns-musk-that-twitter-faces-ban-over-content-moderation-ft-2022-11-30/
- https://finance.yahoo.com/news/content-moderation-services-market-garner-113000018.html
- https://www.grandviewresearch.com/press-release/global-data-annotation-tools-market
- https://downloads.ctfassets.net/3viuren4us1n/7o52tJORlJ4T8TodNYTTt0/ce6ae79529375f2e14ee30f795b7ee87/TIXT_2021_Annual_Report_EN.pdf
- https://seekingalpha.com/article/4553443-telus-international-cda-inc-tixt-q3-2022-earnings-call-transcript
- https://seekingalpha.com/article/4466227-telus-international-cda-inc-tixt-ceo-jeff-puritt-on-q3-2021-results-earnings-call-transcript
- https://downloads.ctfassets.net/3viuren4us1n/5l2yN3eIRb76lKMxvVm4e8/102b09ebc576112b17e67d18067949ab/Telus_International_20-F.pdf
- https://downloads.ctfassets.net/3viuren4us1n/7o52tJORlJ4T8TodNYTTt0/ce6ae79529375f2e14ee30f795b7ee87/TIXT_2021_Annual_Report_EN.pdf
- https://assets.ctfassets.net/3viuren4us1n/HkGdTOAXy5hL8coz8qPZE/cea5896a7f3495f7767cb692293b90e4/TIXT_Q3_2022_Financials_EDGAR.pdf
Recommendation Evaluation Methodology
Lion Capital Group analysts perform a three-stage analysis. They select a promising industry based on the latest news, statistics and industry-specific metrics. They assess the supply and demand situation and its future development dynamics. Industry’s investment attractiveness is mostly affected by the forecasted market growth rates; total addressable market, player concentration level and likeliness of a monopoly formation, as well as the level of regulation by various entities or associations.
The assessment is followed by the comparative analysis based on the selected sample. The sample comprises companies with a market capitalization of over USD 1 billion, but there is space for exceptions (when the suitable level of liquidity for company’s securities is available on the stock exchange). The selected companies (peers) are being compared against each other based on multipliers (EV/S, EV/EBITDA, PE, P/FCF, P/B), revenue growth rates, marginality and profitability (operating income margin, net income margin, ROE, ROA), and business performance.
Having completed the comparative analysis, the analysts carry out a more in-depth research of the news about the selected company. They review company’s development policy, information about its current and potential mergers and acquisitions (M&A activity), and assess the efficiency of company's inorganic growth and other news about it over the past year. The main objective at this stage is to identify the growth drivers and evaluate their stability, as well as the extent of impact they have on the business.
Based on all the data collected, the analysts determine the weighted forecasted figures of company’s growth rates and proposed business marginality, which are used to calculate the company’s multiplier-based estimated value. The said value enables setting the stock price target and stock value growth potential.
The expected timing of the idea implementation is set depending on the current market situation, volatility level and available forecasting horizon for industry and company development. The forecasting period is normally set between 3 and 12 months.
Disclaimer
Information and analytical services and materials are provided by Lion Capital Group as part of the services specified and are not an independent activity. The Company reserves the right to refuse service to persons not meeting the criteria for clients, or those subject to bans / restrictions on such services in accordance with the European Union laws. Restrictions may also be imposed by the internal procedures and controls of Lion Capital Group. Lion Capital Group provides financial services in the European Union in accordance with license CIF 275/15 for all types of activities required by the company as granted by the Cyprus Securities and Exchange Commission (CySEC) on 20.05.2015. Disclaimer: Additional information is available upon request. Investing in securities and other financial instruments always involves the risk of capital loss. The client must personally acknowledge this, including by reading the Risk Disclosure Notice. Opinions and estimates represent our judgments as of the date hereof and are subject to change without notice. Fees, charges and other expenses may reduce the financial performance of your investment. Past returns do not guarantee future returns. This material is not intended to be an offer or solicitation to buy or sell any financial instrument. The opinions and recommendations provided herein do not consider any individual circumstances, goals or needs of the client and do not constitute an investment advisory service. Recipients of this report must make their own independent decisions in relation to any securities or financial instruments referred to herein. The information has been obtained from sources that Lion Capital Group believes to be reliable; its affiliates and/or subsidiaries (jointly referred to as Lion Capital Group) do not guarantee completeness or accuracy of such information, save for disclosures related to Lion Capital Group and/or its affiliates/agents and analyst's interactions with the issuer being the subject of research. All prices provided are indicative closing prices for the securities in question, unless otherwise specified.
Terms and conditions of market research use
Company income statement
| 2023 | |
|---|---|
| Revenue | 2 194.00M |
| EBITDA | 437.00M |
| Net Income | 78.00M |
| Net Income Ratio | 3.56% |
Financial strength
| 2023 | |
|---|---|
| Debt/Eq | 119.09% |
| FCF Per Share | 0.69 |
| Interest Coverage | 4.87 |
| EPS | 0.29 |
| Payout ratio | 0.00% |
Management efficiency
| 2023 | |
|---|---|
| ROAA | 2.15% |
| ROAE | 4.71% |
| ROI | 6.56% |
| Asset turnover | 0.61 |
| Receivables turnover | 4.64 |
Margin
| 2023 | |
|---|---|
| Gross Profit Margin | 80.31% |
| Net Profit Margin | 3.56% |
| Operating Profit Margin | 8.43% |