Why do we like Rapid7 Inc?
Reason 1: Growth trends in the industry
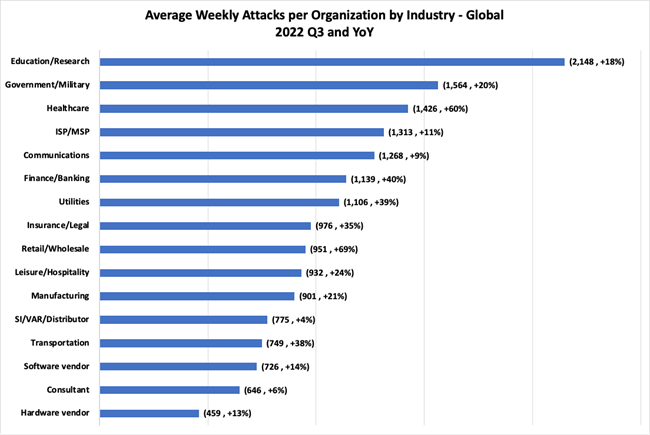
In Q3 2022, the number of global cyber attacks increased by 28% compared to 2021, with the average number of attacks per week surpassing the 1 130 mark, according to a Check Point survey. AAG reports that 76% of survey respondents said that their organisation had experienced at least one cyberattack in a year. This compares to 55% in 2020. The statistics by industry, shown in the chart below, show that healthcare (+60% year-over-year) and finance (+40% year-over-year) are among the leaders in terms of the number of attacks.
Yet, as the infographic from the IBM report below shows, the cost of data leakage is highest in these same industries and is increasing year on year.
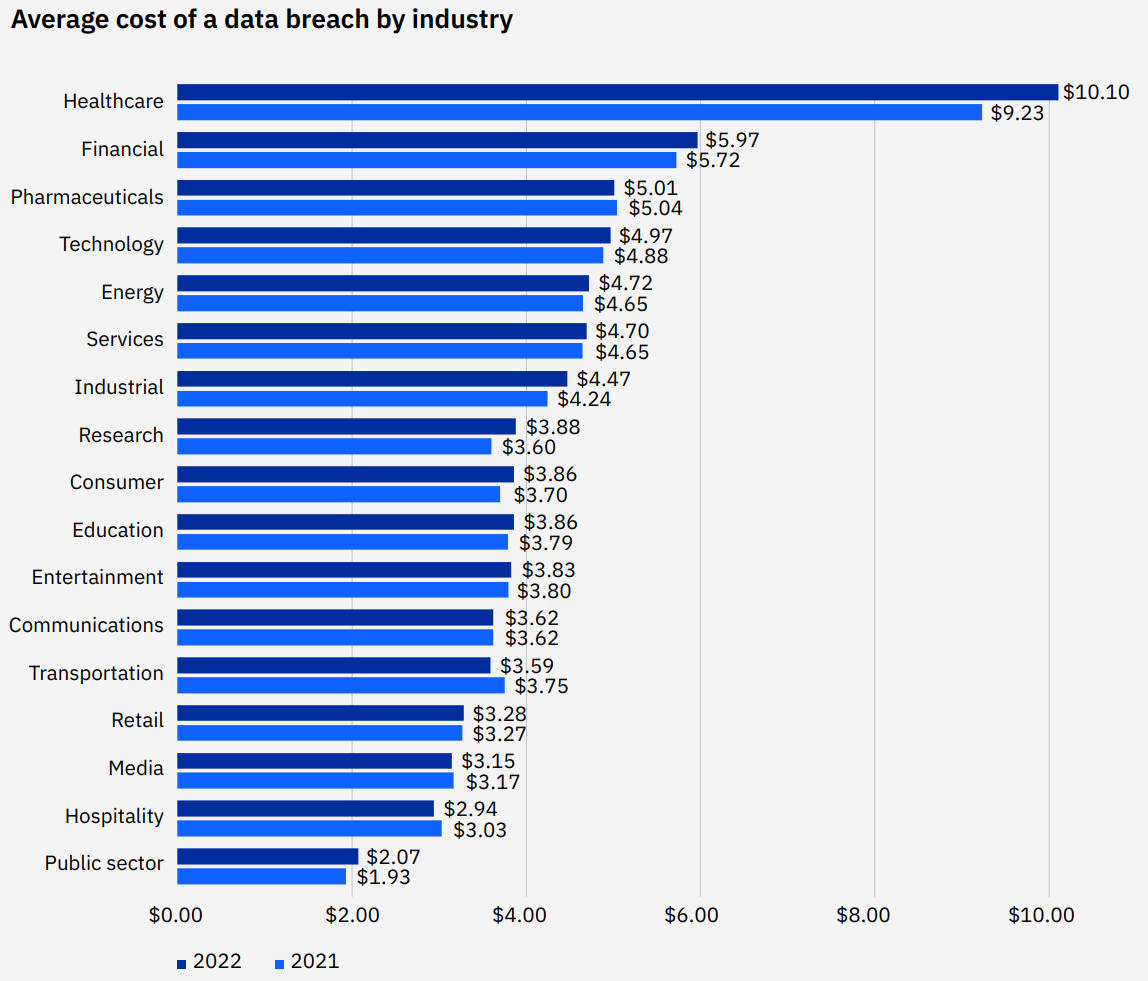
Source: Cost of a data breach 2022 | IBM. Values are in $ million
These statistics play into Rapid7's hands, as not only do these industries handle huge amounts of money, but companies also store significant amounts of sensitive personal data, the leakage of which can be very sensitive to business. As such, businesses will be willing to pay for cybersecurity in any economic climate.
Looking at the breakdown by region from the Check Point study mentioned earlier, it is worth noting that in Q3 2022, the increase in weekly cyber attacks in North America was at 47% and in Europe at 22%. In 2021, these regions generated ~53% of total global GDP, which suggests that there is opportunity and interest from US and European organisations to invest in cyber defence. Separately, we highlight the fact that 79% of Rapid7's revenue is generated in North America, so an increase in cyber attacks in the region could significantly accelerate the company's growth rate.
In the future, Fortinet predicts that a new wave of cybercrime can be expected through the proliferation of Cybercrime-as-a-Service offerings on the darkweb.
Reason 2. Potential of the company
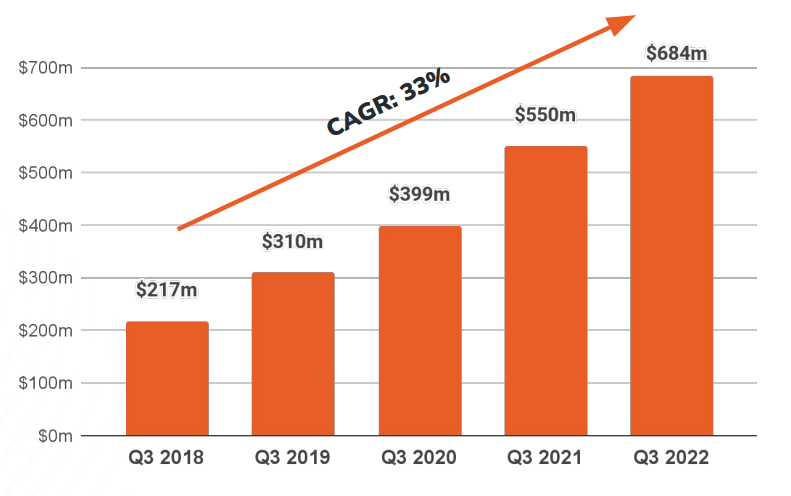
The market's need for greater cybersecurity is reflected in Rapid 7's results: annual recurring revenue (ARR) from Q3 2018 to Q3 2022 showed an average growth rate (CAGR) of 33%:
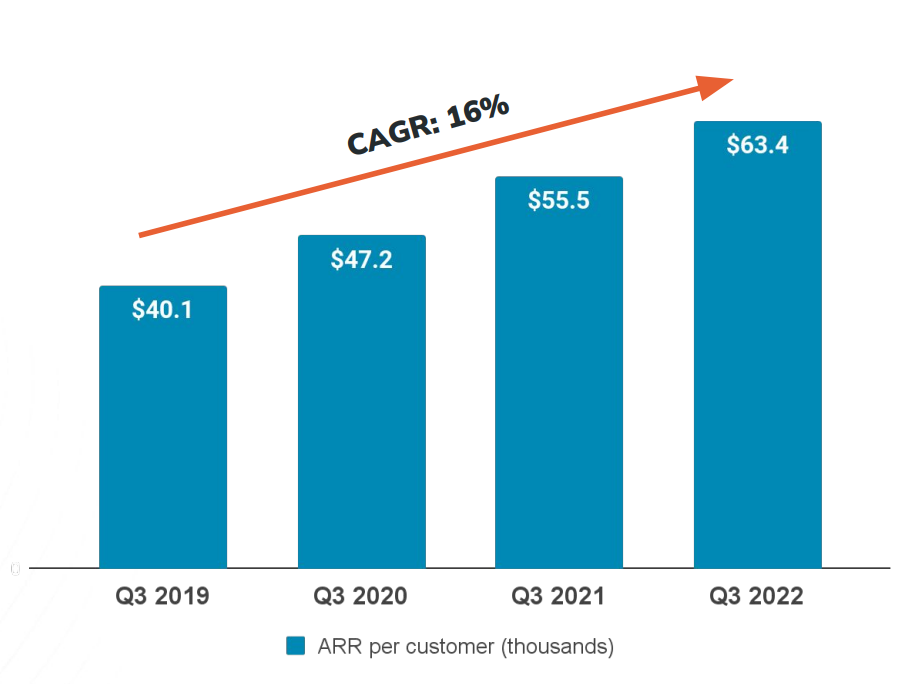
Note that Rapid7 aims to increase annual recurring revenue both by increasing its customer base and by growing revenue per customer. For example, over the period from 2019 to 2022, the average annual growth rate of ARR per customer was 16%. Customer acquisition activity is also paying off, with the number of users increasing year-on-year from 10,283 to 10,791.
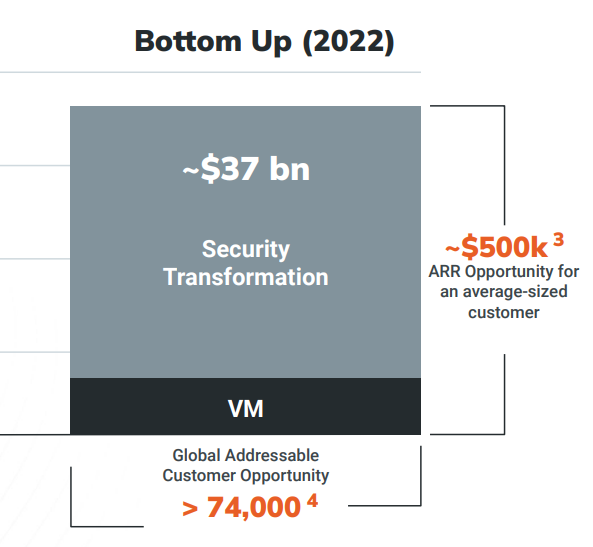
That said, as the illustration below shows, great opportunities remain: the global volume of leads exceeds 74,000, and each medium-sized client has the potential to increase the company's ARR by $500,000 per year.
For Q4 2022, management expects revenue in the range of $179-$181 million, non-GAAP operating profit in the range of $14-$16 million, and free cash flow in the range of $23.8-$27.8 million. If management forecasts come true, the company's Q4 operating margin will improve from -6% to 9% YoY, which should have a positive impact on stock price due to increased investor confidence in the bright future of Rapid7.
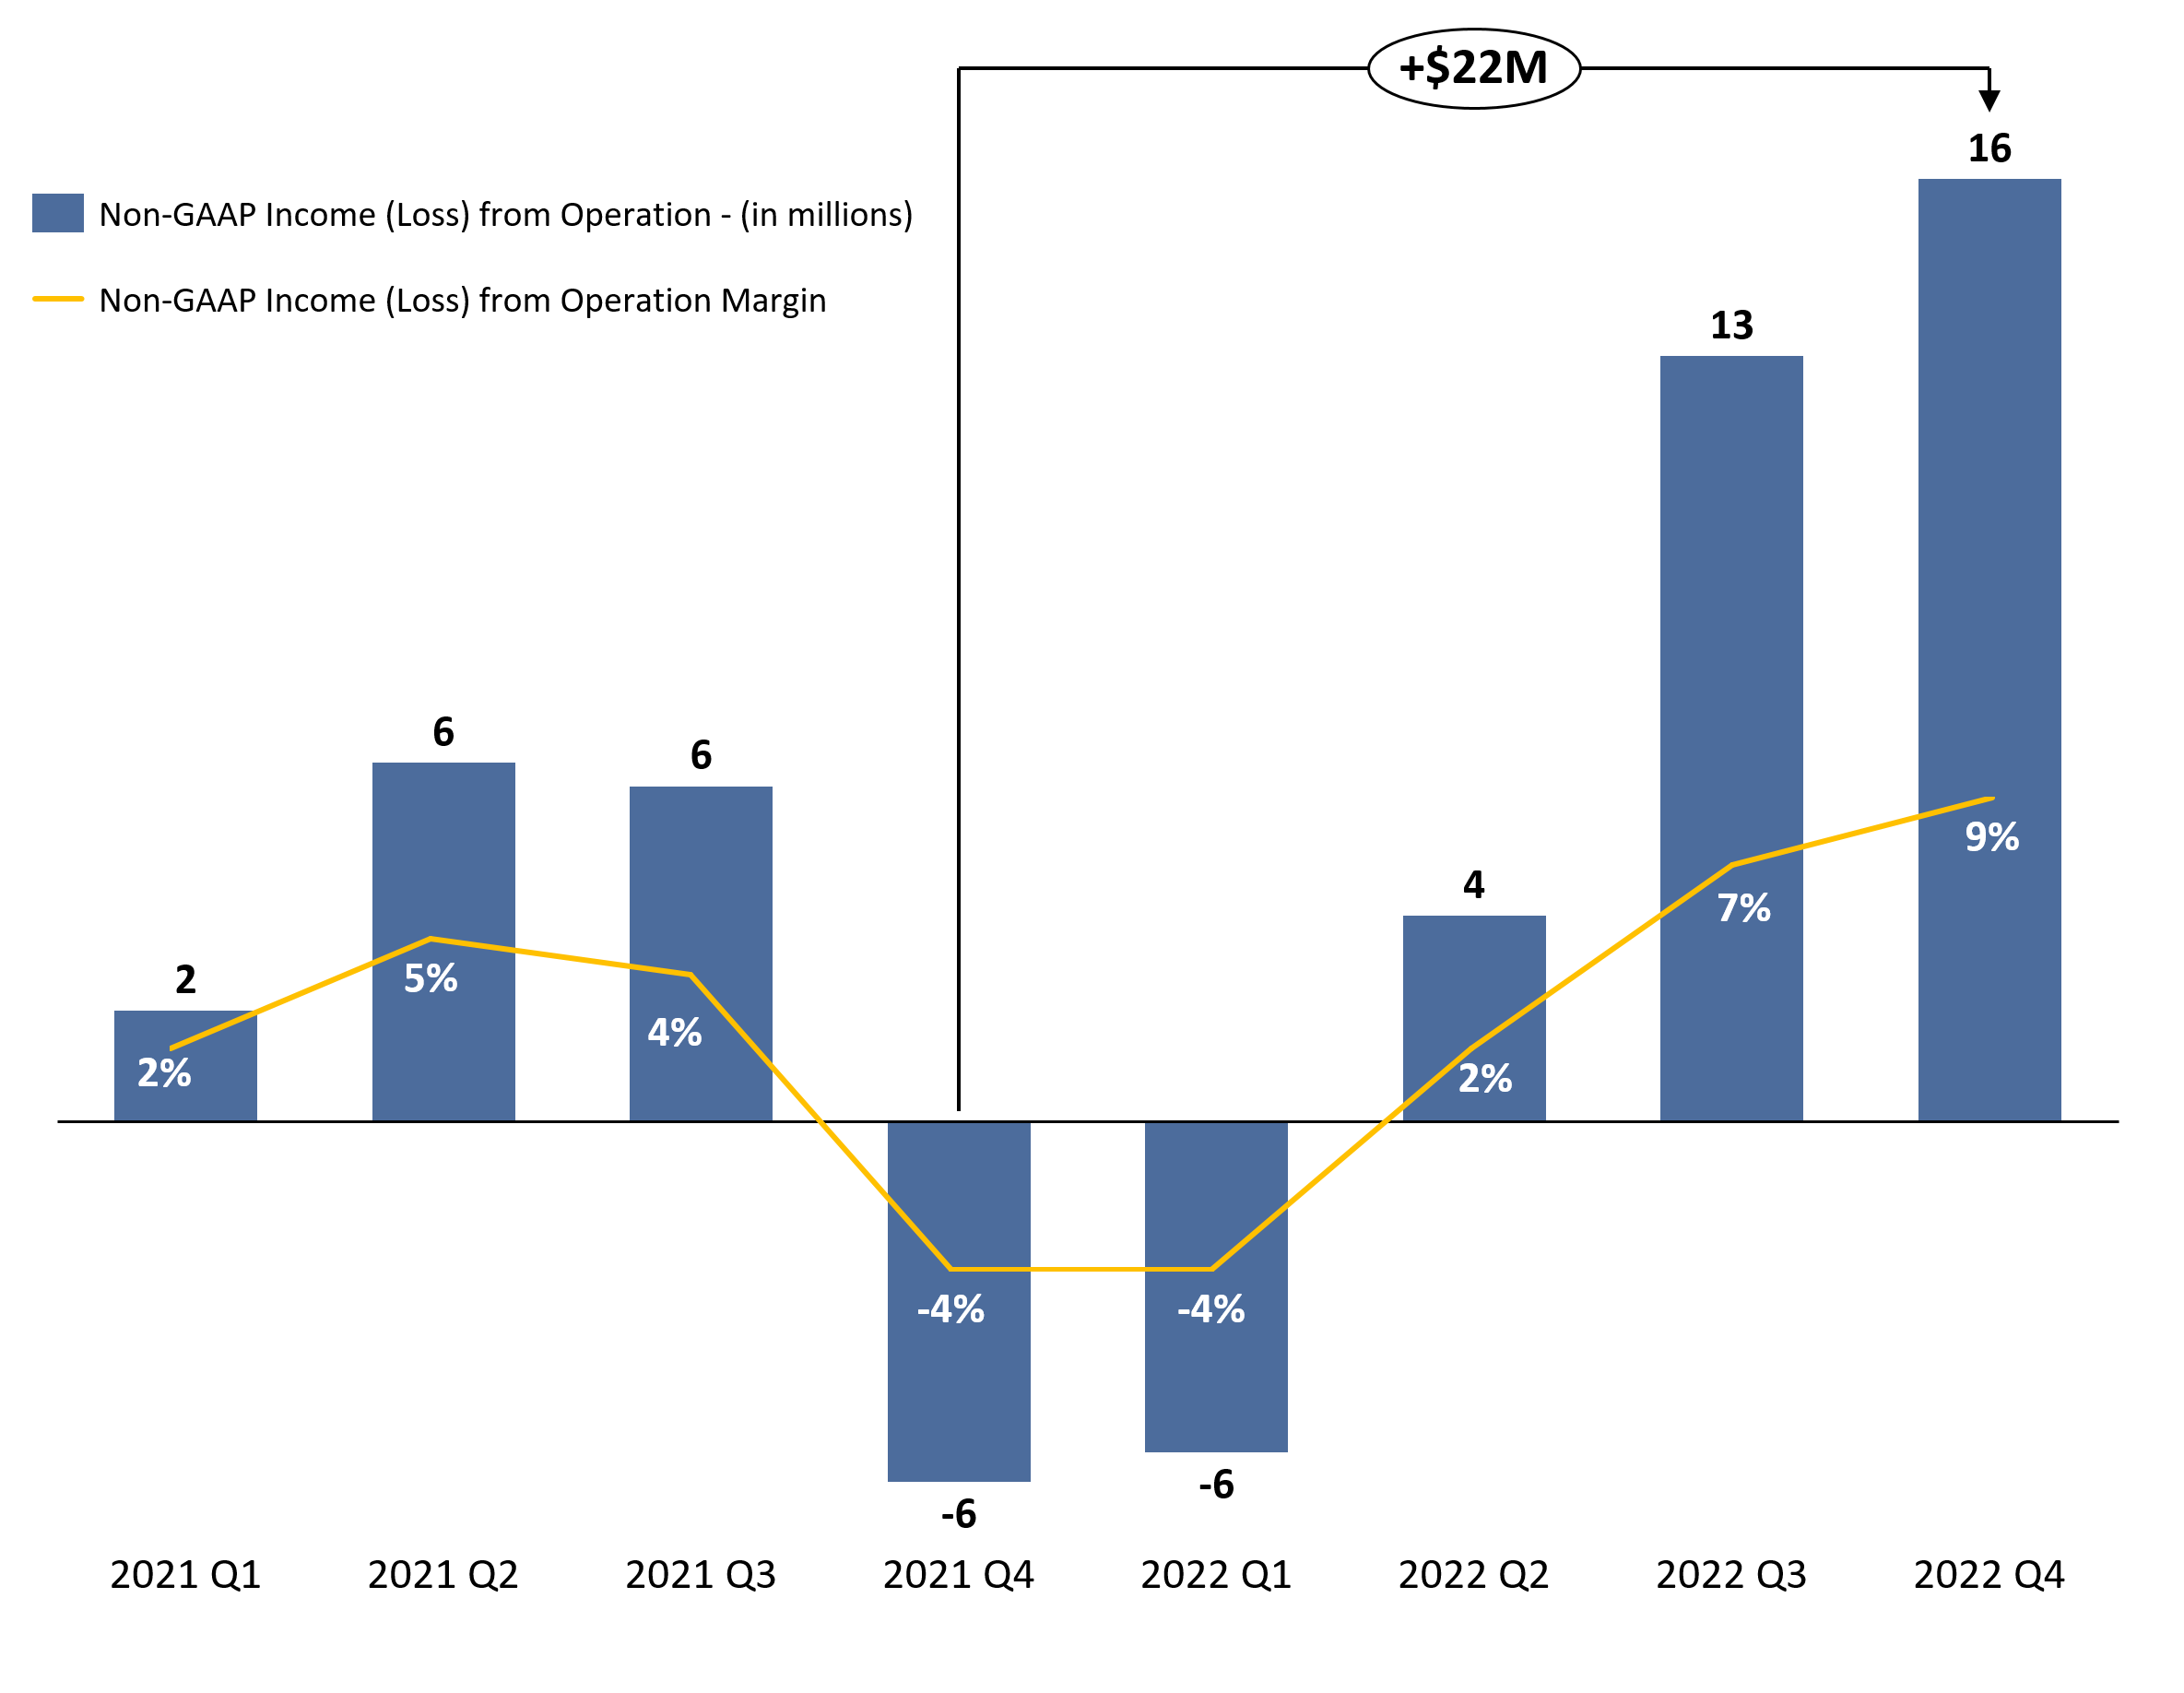
Data source for the graph: Rapid7 financial metrics and Rapid7 3Q22 Investor Presentation
As can be seen from the chart below, the realisation of the Rapid7 projections will also indicate that the company is starting to gain free cash flow volumes at a rapid pace, indicating improved operational processes within the company.
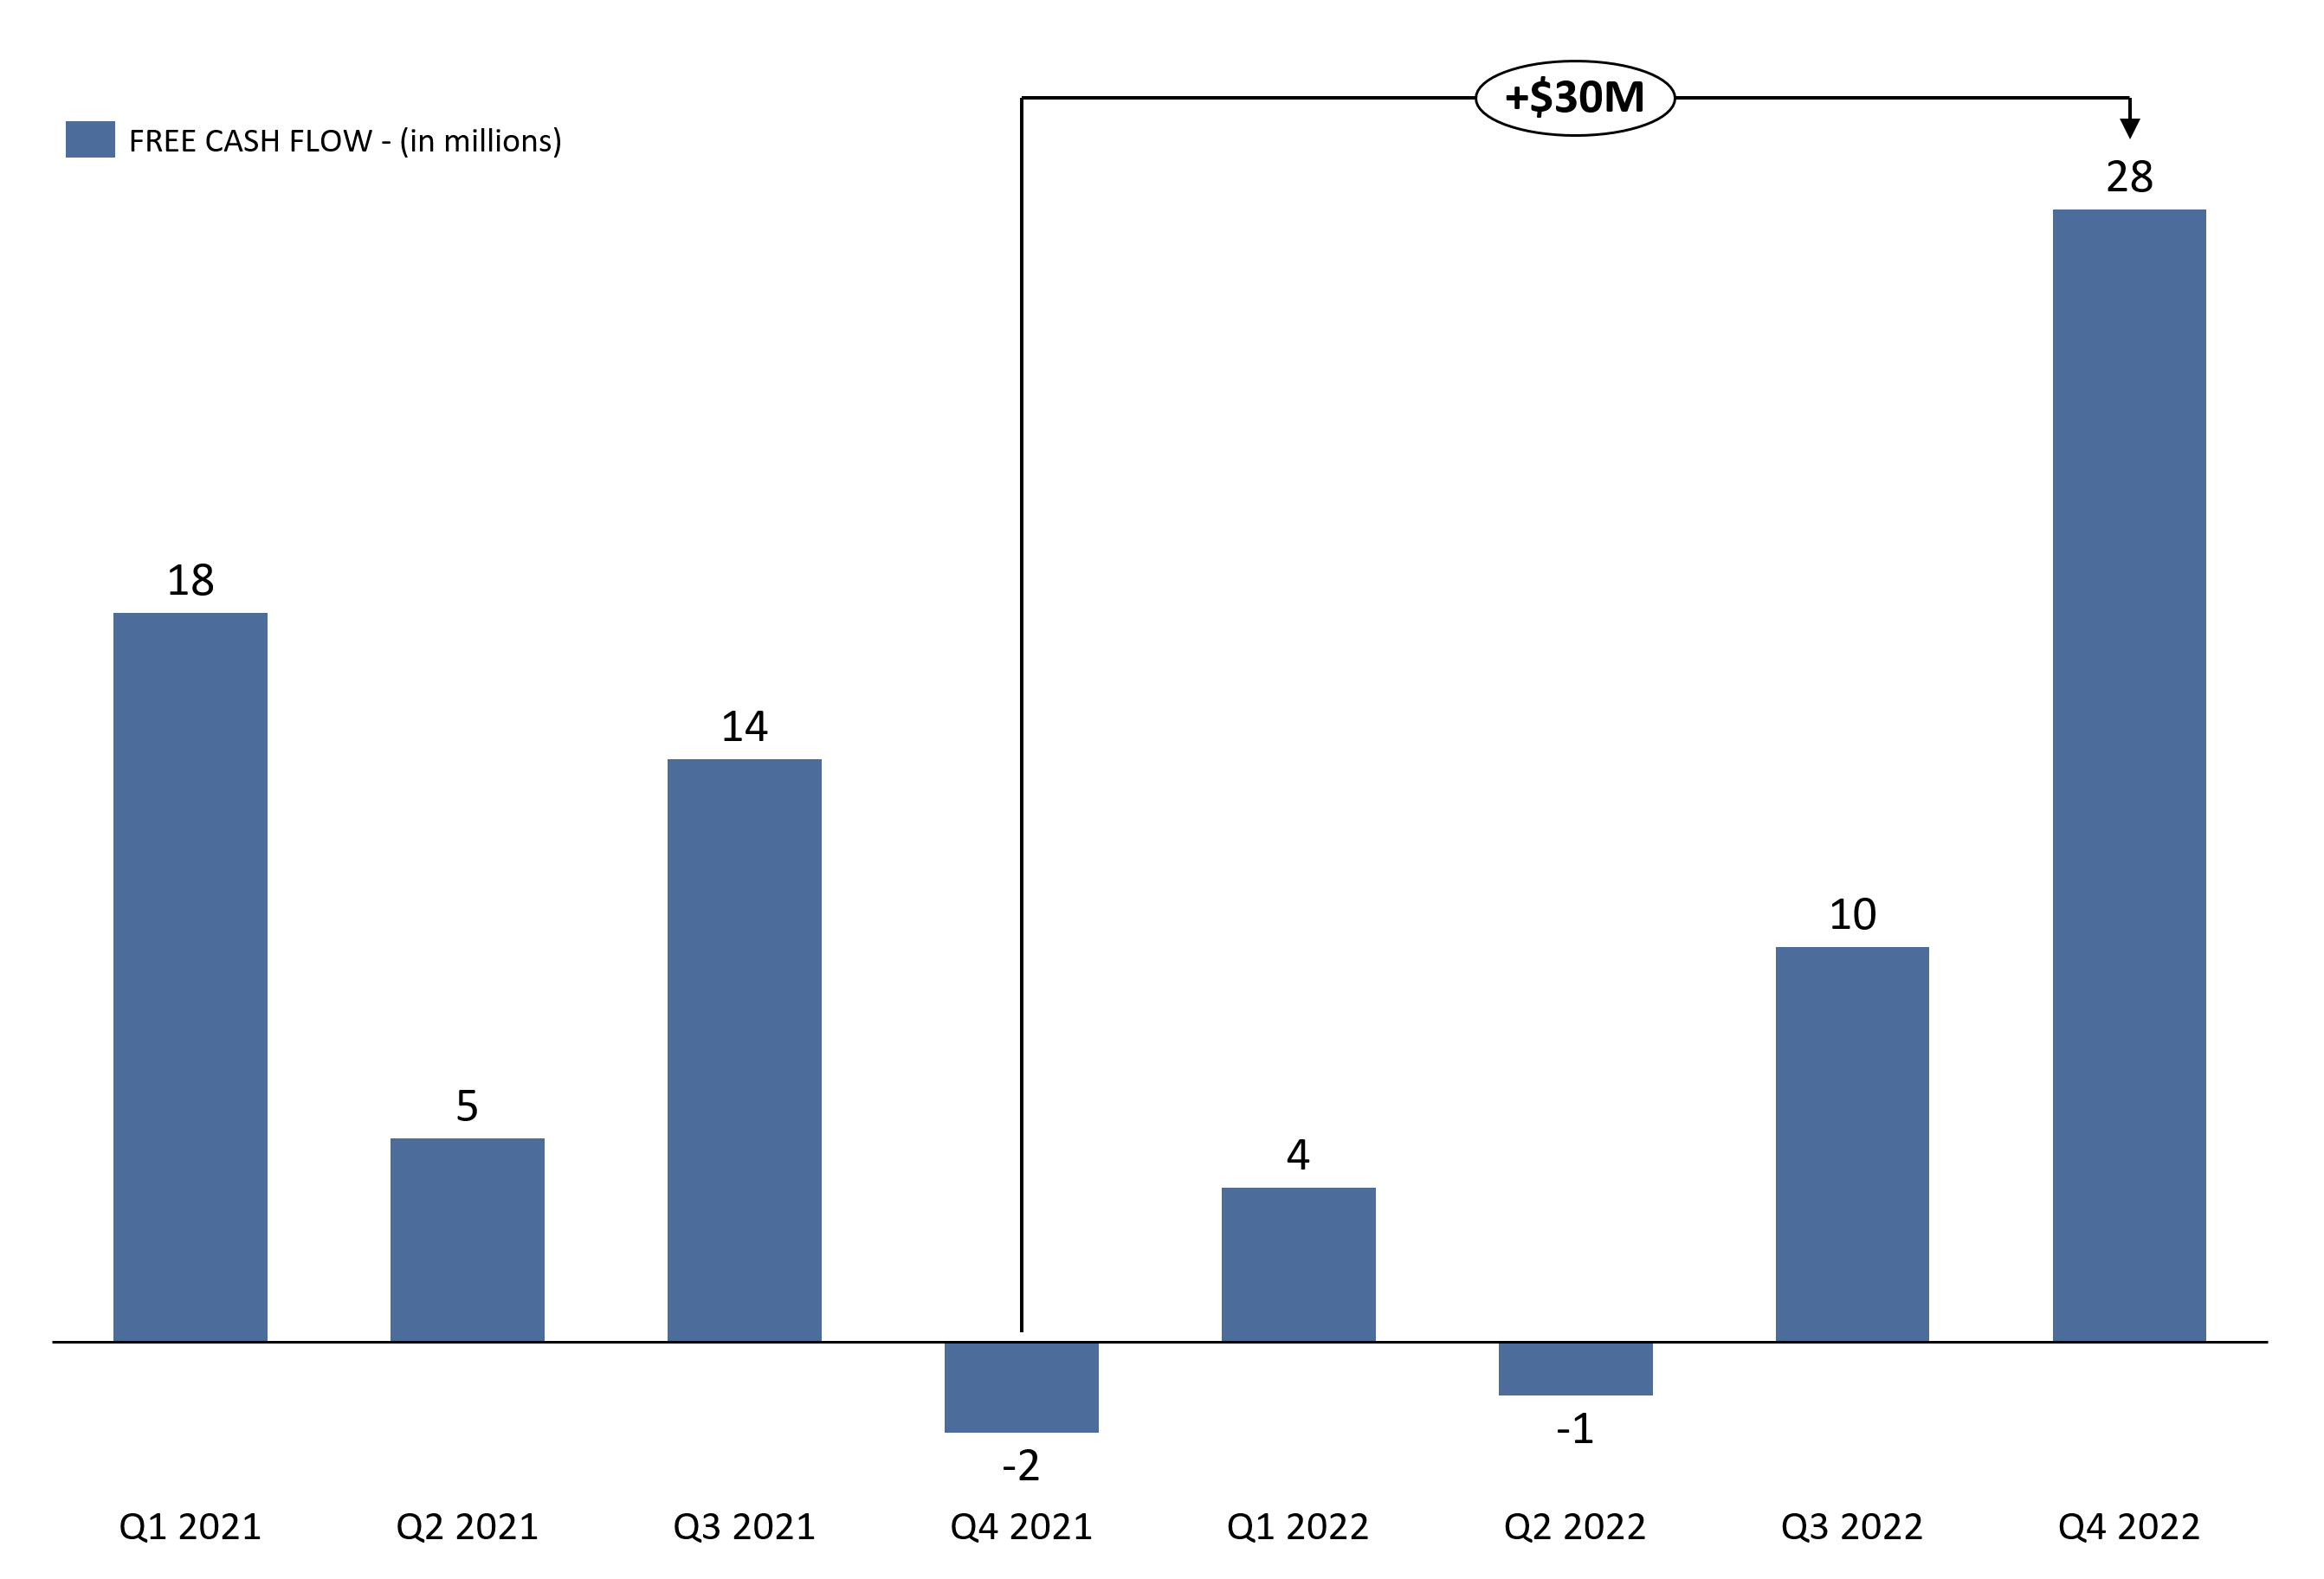
Data source for the graph: Rapid7 financial metrics and Rapid7 3Q22 Investor Presentation
Supporting Rapid7 in the achievement of these goals will be the positive news:
- On 26 July, Rapid7 introduced new contextual capabilities to the InsightCloudSec platform, allowing security teams to gain real-time, consolidated insight across their entire infrastructure into risk signals, including misconfiguration and public dissemination of information. The increased frequency of cyber-attacks mentioned earlier may increase interest in such products, enabling a more rapid response.
- On 27 September, the company announced that it had been added to the US Department of Homeland Security's "Continuous Diagnostics and Mitigation Program" list of approved products. This decision allows government agencies to use Rapid7 solutions to manage vulnerability risks. We expect this market expansion to have a positive impact on Rapid 7 Inc.'s financial results on the investment idea horizon.
Financial indicators
The company's results for the last 12 months:
TTM revenue: up from $496.9 million to $652.2 million
TTM operating profit: down from -$ 100 million to -$ 139 million
in terms of operating margin, decrease from -20.1% to -21.3% due to an increase in the cost of revenue from 30.8% to 32.1%
TTM net profit: down from -$130.6 million to -$158 million:
in terms of net margin, up from -26.3% to -24.2% due to lower interest costs
Operating cash flow: down from $49.8 million to $42.7 million
Free cash flow: down from $29.4 million to $10.1 million. The effect is mainly due to the fact that the company raised new debt financing in 2021 for the takeover, which was reflected in cash flow.
Based on the results of the most recent reporting period:
Revenue: up from $139.9 million to $175.8 million
Operating profit: up from -$34.3 million to- $23.2 million:
in terms of operating margin, increase from -24.5% to -13.2%, mainly due to a decrease in depreciation costs from 5.4% to 2.1% and R&D costs from 30.7% to 27.0%
Net profit: up from -$37.7 million to -$28.7 million:
in terms of net margin, up from -26.9% to -16.3%
Operating cash flow: up from $14.5 million to $20.1 million
Free cash flow: down from $37.2 million to $9.7 million, mainly due to higher levels of capital expenditure
Despite the high base effect of 2021, further compounded by the new challenges of 2022, Rapid 7 reported strong financial results in the last quarter. As we said before, we expect a further improvement in financial performance in Q4.
- Cash and liquid assets: $251.6 million
- Net debt: $563.4 million
The company has an adequate level of debt, but it should be noted that Rapid7 is generating losses at its current stage of development, which increases the level of risk for the investor.
Evaluation
In terms of trading multiples, the company is more expensive than its peers on most metrics except EV/S (3.53x vs. 4.02x). In our view, such multiples adequately reflect Rapid7's further growth potential.
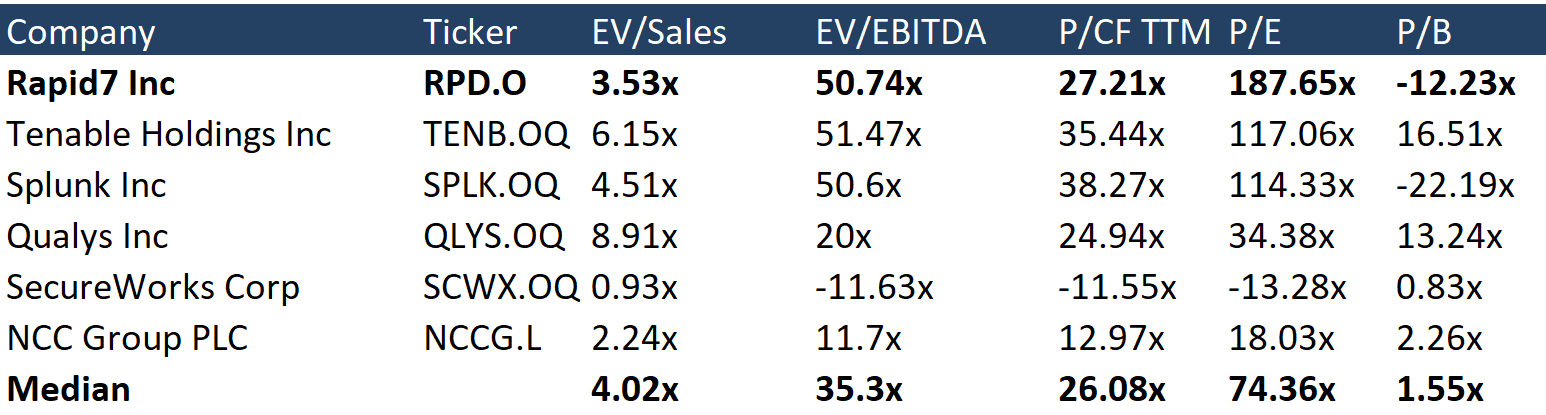
Source: Refinitiv
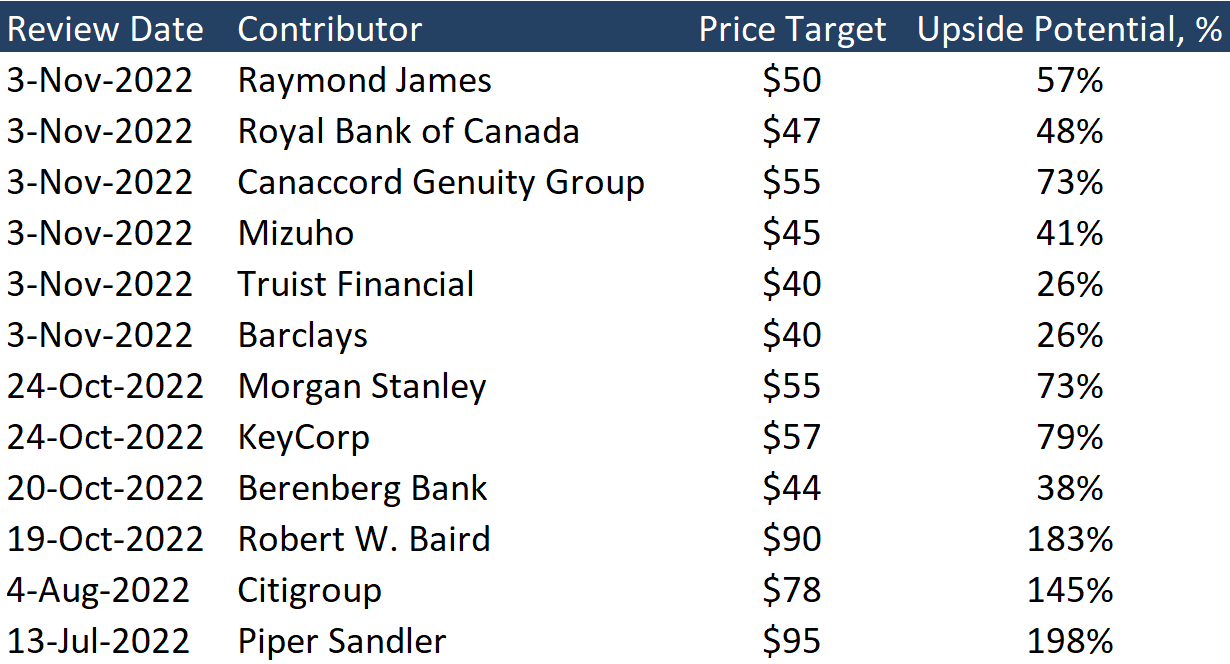
Ratings of other investment houses
The minimum price target set by Truist Financial and Barclays is $40 per share. Piper Sandler, on the other hand, has set a target price of $95 per share. According to the consensus, the fair value of the stock on a recommendation from the beginning of summer is $31.84 per share, which suggests an upside of 82%.
Source: Marketbeat
Key risks
- So far, the company is not generating a net profit. If financial difficulties arise, there could be considerable volatility in the stock price.
- Despite the critical importance of defending against cyber-attacks, in the event of a major recession, customers will want to minimise their costs.
Sources of information
- https://blog.checkpoint.com/2022/10/26/third-quarter-of-2022-reveals-increase-in-cyberattacks/
- https://aag-it.com/the-latest-cyber-crime-statistics/
- https://www.ibm.com/reports/data-breach
- https://investor.fortinet.com/news-releases/news-release-details/fortiguard-labs-predicts-convergence-advanced-persistent-threat
- https://s29.q4cdn.com/157304370/files/doc_financials/2022/q3/Investor-Deck-Q3'22-Earnings.pdf
- https://s29.q4cdn.com/157304370/files/doc_financials/2022/q3/RPD-Q3-2022-Financial-Metrics-File.xlsx
- https://d18rn0p25nwr6d.cloudfront.net/CIK-0001560327/446f17fb-3900-42cb-9565-a8d2fed61eaa.pdf
- https://investors.rapid7.com/news/news-details/2022/Rapid7-Introduces-New-Layered-Context-Capabilities-for-InsightCloudSec/default.aspx
- https://www.rapid7.com/about/press-releases/rapid7-added-to-the-department-of-homeland-securitys--continuous-diagnostics-and-mitigation-programs-approved-products-list/
- https://www.marketbeat.com/stocks/NASDAQ/RPD/price-target/
Disclaimer
Information and analytical services and materials are provided by Lion Capital Group as part of the services specified and are not an independent activity. The Company reserves the right to refuse service to persons not meeting the criteria for clients, or those subject to bans / restrictions on such services in accordance with the European Union laws. Restrictions may also be imposed by the internal procedures and controls of Lion Capital Group. Lion Capital Group provides financial services in the European Union in accordance with license CIF 275/15 for all types of activities required by the company as granted by the Cyprus Securities and Exchange Commission (CySEC) on 20.05.2015. Disclaimer: Additional information is available upon request. Investing in securities and other financial instruments always involves the risk of capital loss. The client must personally acknowledge this, including by reading the Risk Disclosure Notice. Opinions and estimates represent our judgments as of the date hereof and are subject to change without notice. Fees, charges and other expenses may reduce the financial performance of your investment. Past returns do not guarantee future returns. This material is not intended to be an offer or solicitation to buy or sell any financial instrument. The opinions and recommendations provided herein do not consider any individual circumstances, goals or needs of the client and do not constitute an investment advisory service. Recipients of this report must make their own independent decisions in relation to any securities or financial instruments referred to herein. The information has been obtained from sources that Lion Capital Group believes to be reliable; its affiliates and/or subsidiaries (jointly referred to as Lion Capital Group) do not guarantee completeness or accuracy of such information, save for disclosures related to Lion Capital Group and/or its affiliates/agents and analyst's interactions with the issuer being the subject of research. All prices provided are indicative closing prices for the securities in question, unless otherwise specified.
Terms and conditions of market research use
Company income statement
| 2023 | |
|---|---|
| Revenue | 535.40M |
| EBITDA | -88.12M |
| Net Income | -146.33M |
| Net Income Ratio | -27.33% |
Financial strength
| 2023 | |
|---|---|
| Debt/Eq | -1128.62% |
| FCF Per Share | 0.63 |
| Interest Coverage | -8.40 |
| EPS | -2.61 |
| Payout ratio | 0.00% |
Management efficiency
| 2023 | |
|---|---|
| ROAA | -11.29% |
| ROAE | 116.14% |
| ROI | -14.51% |
| Asset turnover | 0.41 |
| Receivables turnover | 3.66 |
Margin
| 2023 | |
|---|---|
| Gross Profit Margin | 68.44% |
| Net Profit Margin | -27.33% |
| Operating Profit Margin | -22.43% |